The index witnessed a range bound activity wherein the Nifty oscillated in 200 points range - ICICI Direct

Follow us Now on Telegram ! Get daily 10 - 12 important updates on Business, Finance and Investment. Join our Telegram Channel
https://t.me/InvestmentGuruIndiacom
Download Telegram App before Joining the Channel
Nifty: 15350
Technical Outlook
* The index witnessed a range bound activity wherein the Nifty oscillated in 200 points range. After subdued opening, supportive efforts emerged from Friday’s low (15183) that helped index to recoup intraday losses. As a result, daily price action formed an inside bar within Friday’s trading range (15400-15183), indicating pause after six sessions decline in a row. In the process, the broader market sold off amid low FII activity
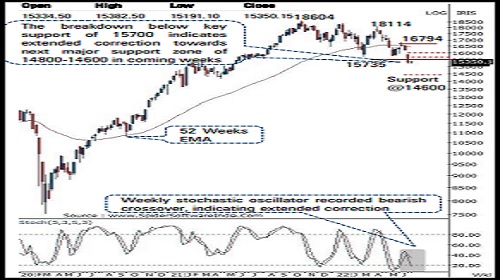
* The formation of lower high-low on the weekly chart signifies extended corrective phase. However, bearish extreme readings on momentum and sentiment indicator suggest that going aggressive short at lower levels should be avoided as technical pullbacks cannot be ruled out amid oversold reading of daily stochastic oscillator (placed at 13). Going ahead, for a meaningful pullback to materialise, the index needs to form higher high-low on weekly timeframe along with improvement in market breadth. In the process, 15800 will act as key resistance on up side
* On the contrary, next major support zone is placed in the range of 14800-14600 for coming weeks as it is confluence of: A) 80% retracement of CY-21 rally (13596-18604), at 14600 B) implicated target of recent consolidation breakdown 16800-15700, is placed at 14600
* Structurally, the sentiment indicators are approaching their bearish extremes. Historically, such bearish extreme conditions posses distinctive nature of a technical pullback in subsequent weeks. The key observations on sentiment indicators are as follows:
* A) Historically, reading of percentage of stock above 200 DMA below 15 signifies extreme pessimism in the markets. From behavioural perspective such levels are produced when sentiments are bearish and participation turns low thereby leading to a durable bottom formation from medium term perspective. Therefore, current reading of 12 (which is lowest since March 2020) signifies impending pullback in following weeks B) Empirically, net advance - decline below -450 signifies market sentiment at its bearish extreme. Last week, we observed extreme oversold reading of -459 indicating impending pullback
* Historically, in three instances over past decade, maximum bull market correction in the Nifty Midcap, Small cap indices have been to the tune of 28% and 38%, respectively. In current scenario both indices have corrected 25% and 34%, respectively. Therefore, 3-4% correction from hereon cannot be ruled out. However such correction amid oversold territory would set the stage for a technical pullback in coming weeks
* In the coming session, index is likely to open on a flat note tracking positive Asian cues. We believe, holding Monday’s low 15202 would keep pullback option open. Hence, use intraday dip towards 15280- 15312 for creating long position for the target of 15397
NSE Nifty Weekly Candlestick Chart
Nifty Bank: 326843
Technical Outlook
* The daily price action formed a high wave candle which mostly remained contained inside previous session high - low range signaling continuation of the corrective bias as index remain below the last week breakdown area of 33000 levels
* Index after sharp 11 % decline in just three weeks has approached oversold territory with daily stochastic placed at a reading of 17 suggesting that going aggressive short at lower levels should be avoided as technical pullbacks could not be ruled out . However, the Index need to start forming higher high -low in the daily chart on a sustained basis for any technical pullback to materialize in the coming sessions . Failure to do so will keep the bias negative and will lead to extension of decline towards the 31000 levels
* Index has immediate hurdle around 33800 levels being the confluence of the lower band of the last Monday’s gap down area (33774 -34345 ) and the 38 . 2 % retracement of the last three weeks decline (36083 -32291 )
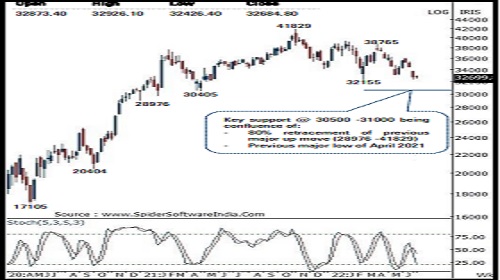
* The index has support around 30500 -31000 levels being the confluence of the following technical observations : (a) 80 % retracement of the previous major rally of December 2020 -October 2021 (28976 -41829 )
* (b) previous major low of April 2021 is also placed at 30405 In the coming session, index is likely to open on a flat to positive note amid positive Asian cues . We expect the index to trade in a range with positive bias while holding above Monday’s low (32447 ) . Hence after a positive opening use intraday dips towards 32540 -32620 for creating long position for the target of 32880 , maintain a stoploss at 32430
Nifty Bank Index – Weekly Candlestick Chart
To Read Complete Report & Disclaimer Click Here
https://secure.icicidirect.com/Content/StaticData/Disclaimer.html
Above views are of the author and not of the website kindly read disclaimer


 signs MOU with Marriot Group of Hotels.jpg)


Tag News

Stock Picks : TCS Ltd And Chambal Fertiliser Ltd By ICICI Direct