The index has formed a bearish candle with either side long shadows indicating extreme volatility at higher levels - Axis Securities

Follow us Now on Telegram ! Get daily 10 - 12 important updates on Business, Finance and Investment. Join our Telegram Channel
https://t.me/InvestmentGuruIndiacom
Download Telegram App before Joining the Channel
Nifty
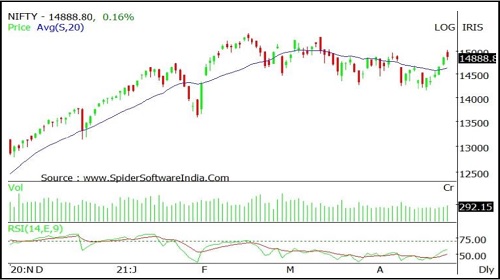
Nifty opened on a positive note and extended buying momentum in the first half however we witnessed profit booking in the later half of the day. Nifty closed at 14895 with a gain of 30 points.
On the daily chart the index has formed a bearish candle with either side long shadows indicating extreme volatility at higher levels. The index continues to move in a Higher Top and Higher Bottom formation on the hourly chart indicating positive bias. The chart pattern suggests that if Nifty crosses and sustains above 14950 level it would witness buying which would lead the index towards 15100-15200 levels. However if index breaks below 14800 level it would witness selling which would take the index toward s 14700-14600. Nifty is trading above its 20 day SMA which indicates positive bias in the short term. Nifty continues to remain in an uptrend in the medium and long term, so buying on dips continues to be our preferred strategy.
The daily strength indicator RSI has turned positive from the oversold territory and is above its reference line indicating sustained uptrend.
The trend deciding level for the day is 14920. If NIFTY trades above this level then we may witness a further rally up to 15020-15150-15250 levels. However, if NIFTY trades below 14920 levels then we may see some profit booking initiating in the market, which may correct up to 14790-14690-14560 levels
Banknifty
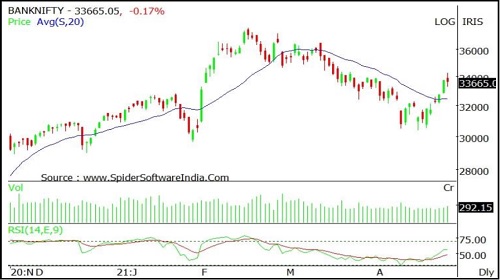
Banknifty opened with an upward gap and formed shadows on either side indicating lack of bullish confidence amongst participants . Banknifty closed at 33715 with a loss of 8 points.
On the daily chart the index has formed a bearish candle with either side long shadows indicating extreme volatility at higher levels. The index continues to move in a Higher Top and Higher Bottom formation on the hourly chart indicating positive bias. The chart pattern suggests that if Banknifty crosses and sustains above 33800 level it would witness buying which would lead the index towards 34200-24600 levels. Important Supports for the day is around 33200 However if index sustains belwo 33200 then it may witness profit booking which would take the index towards 32800-32400 levels.. Banknifty is trading above its 20 day SMA which indicates positive bias in the short term. Banknifty continuees to remain in an uptrend in the medium and long term, so buying on dips continues to be our preferred strategy.
The daily strength indicator RSI has turned positive from the oversold territory and is above its reference line indicating sustained uptrend.
The trend deciding level for the day is 33770. If BANK NIFTY trades above this level then we may witness a further rally up to 34235-34750-35215 levels. However, if BANK NIFTY trades below 33770 levels then we may see some profit booking initiating in the market, which may correct up to 33250-32785-32270 levels
To Read Complete Report & Disclaimer Click Here
For More Axis Securities Disclaimer https://simplehai.axisdirect.in/disclaimer-home
SEBI Registration number is INZ000161633
Views express by all participants are for information & academic purpose only. Kindly read disclaimer before referring below views. Click Here For Disclaimer