The index contrary to our expectations closed below the support area of 33000 levels during previous week - ICICI Direct

Follow us Now on Telegram ! Get daily 10 - 12 important updates on Business, Finance and Investment. Join our Telegram Channel
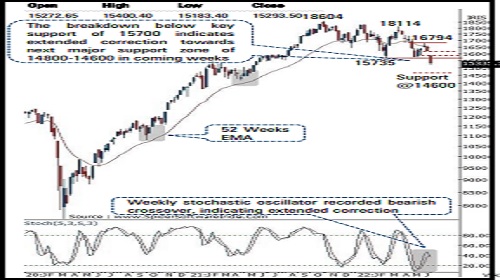
Key support for the Nifty is placed at 14800 -14600 range…
Technical Outlook
* The index witnessed a gap down opening (16202-15877) and drifted southward as the week progressed. The selling pressure accelerated on the breach of key support of 15700 which was held over past three months. The weekly price action formed a sizable bear candle carrying lower high-low, indicating acceleration of downward momentum. As a result, daily stochastic oscillator approached oversold territory with a reading of 8. Meanwhile, India VIX regained upward momentum after four weeks decline.
* The breakdown below key support of 15700 along with across sector sell-off indicates extended corrective phase towards next major support zone of 14800-14600 in coming weeks as it is confluence of: A) 80% retracement of CY-21 rally (13596-18604), at 14600 B) implicated target of recent consolidation breakdown 16800-15700, is placed at 14600
* However, bearish extreme readings on momentum and sentiment indicator suggest that going aggressive short at lower levels should be avoided as technical pullbacks could not be ruled out. Going ahead, for a meaningful pullback to materialise, index needs to form higher high-low on weekly timeframe along with improvement in market breadth. In the process, 15800 will act as key resistance on up side.
* Structurally, the sentiment indicators are approaching their bearish extremes. Historically, such bearish extreme conditions posses distinctive nature of a technical pullback in subsequent weeks. The key observations on sentiment indicators are as follows:
* A) Historically, reading of percentage of stock above 200 DMA below 15 signifies extreme pessimism in the markets. From behavioural perspective such levels are produced when sentiments are bearish and participation turns low thereby leading to a durable bottom formation from medium term perspective. Therefore, current reading of 14 (which is lowest since March 2020) signifies impending pullback in following weeks B) Empirically, net advance - decline below -450 signifies market sentiment at its bearish extreme. Current week we observed a reading of -459 indicating extreme oversold market conditions and impending pullback
* From medium term perspective this is an opportune time to construct portfolio in a staggered manner with focus on Large caps. We prefer Reliance Industries, Infosys, Axis bank, SBI, Tata Motors, ITC, L&T, ABB from medium term perspective
* Historically, in three instances over past decade, maximum bull market correction in the Nifty Midcap, Small cap indices have been to the tune of 28% and 38%, respectively. In current scenario both indices have corrected 22% and 32%, respectively. Therefore, 4-5% correction from hereon cannot be ruled out. However such correction amid oversold territory would set the stage for a technical pullback in coming weeks
* In the coming session, index is likely to open on a flat note tracking mixed Asian cues. We expect corrective bias to continue as long as lower high-low formation maintained. Hence, use intraday pullback towards 15360-15392 for creating short position for the target of 15271.
NSE Nifty Weekly Candlestick Chart
Nifty Bank: 32743
Technical Outlook
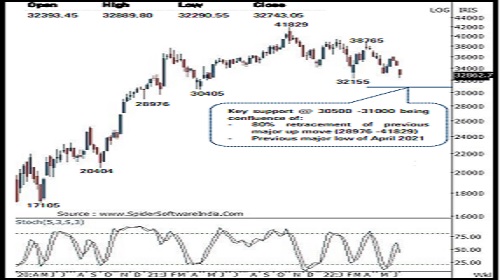
* The weekly price action formed a sizable bear candle with a lower high -low and a bearish gap above its head (34346 -33774 ) signaling extension of the corrective decline . The index contrary to our expectations closed below the support area of 33000 levels during previous week
* Daily stochastic has approached oversold territory with a reading of 13 , however the Index need to start forming higher high -low in the daily chart on a sustained basis for any technical pullback to materialize in the coming sessions . Failure to do so will keep the bias negative and will lead to extension of decline towards the 31000 levels
* Index has immediate hurdle around 33800 levels being the confluence of the lower band of the last Monday’s gap down area (33774 -34345 ) and the 38 . 2 % retracement of the last three weeks decline (36083 -32291 )
* The index has support around 30500 -31000 levels being the confluence of the following technical observations :
* (a) 80 % retracement of the previous major rally of December 2020 -October 2021 (28976 -41829 )
.* (b) previous major low of April 2021 is also placed at 30405
In the coming session, index is likely to open on a flat to negative note amid weak Asian cues . We expect the index to trade with corrective bias while last week breakdown area of 33000 is likely to act as resistance . Hence use intraday pullback towards 32850 -32930 for creating short position for the target of 32610 , maintain a stoploss at 33040
Nifty Bank Index – Weekly Candlestick Chart
To Read Complete Report & Disclaimer Click Here
https://secure.icicidirect.com/Content/StaticData/Disclaimer.html
Above views are of the author and not of the website kindly read disclaimer


Tag News

Stock Picks : TCS Ltd And Chambal Fertiliser Ltd By ICICI Direct