The formation of higher high-low on the weekly chart indicates pause in downward momentum - ICICI Direct

Nifty
Technical Outlook
• The index started the session with a positive gap 17274-17379 and sustained above 17300 mark throughout the session. The daily price action resulted in a small bear candle carrying higher high-low, indicating breather after 4% rally seen over past four sessions. In the process, Nifty filled the 26th September negative gap 17327-17156
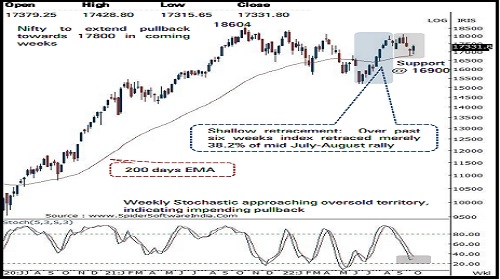
• The formation of higher high-low on the weekly chart indicates pause in downward momentum. Going ahead, sustainability above 17500 would lead to acceleration of upward momentum towards 17800 in coming weeks as it is confluence of: A) 80% retracement of September decline (18096-16748) placed at 17826 B) Implicated target of recent consolidation 17300-16750 is placed at 17850. Thus any cool off from hereon towards 16900 due to global volatility should be used as incremental buying opportunity in quality stocks ahead of earning season. Our view of extension of technical pullback is further validated by following observations:
• A) Historically, September has been a volatile month. However, over past two decades, Q4 returns in a calendar year for Nifty has been positive (average 11% and minimum 5%) on 70% of the times. The history favours buying dips from hereon
• B) Indian equities continued to relatively outperform global peers while pricing in many negatives. While most global equity benchmarks have tested June lows, Nifty is 10% away from June lows
• Structurally, over the past six weeks’ index has retraced ~38.2% of preceding nine week’s rally (15185-18000) while absorbing global volatility, signifying healthy retracement amid relative outperformance against global peers. Going ahead, we expect index to hold the key support of 16900 in the near term as it is confluence of: A) 200 days EMA is placed at 16888 B) Current weeks low of 16855
• In the coming session, index is likely to witness soft opening tracking muted global cues. We expect, buying demand to emerge in the vicinity of 50 days EMA. Thus, after initial decline use dip towards 17210-17242 for creating long position for the target of 17242
Bank Nifty
Technical Outlook
• The index opened with a gap up action and achieved our target of 39500 in the morning session before trading in a range for rest of the session . Price action resembled inverted hammer with higher shadow indicating mild profit booking at 50 % retracement of September decline, after sharp 2000 points up move in just four sessions
• As mentioned in yesterday’s edition of this report, while a temporary breather around 39500 cannot be ruled out, we expect index to eventually surpass 39500 levels and therefore recommend buying any temporary retracement towards 38500 -38700 zone which is expected to act as elevated support for prices
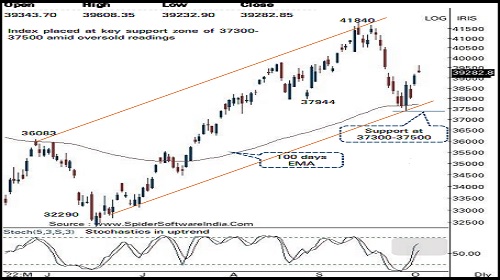
• Key observation during last week is index corrected 10 . 5 % from life highs over 11 sessions (41840 -37386), equating current price/time decline with its May -June decline (36083 - 32290 ) and made a sharp pullback validating support zone around 37500 levels
• Structurally, the index has witnessed a faster retracement as eight month’s decline (41829 -32990 ) was completely retraced in just two and half months highlighting overall positive bias
• The index has support around 37300 -37500 levels as it is the confluence of the 100 days EMA (currently placed at 37640), lower band of rising channel accompanying price action since June lows at 37450 and the 50 % retracement of the major up move (32290 -41840 )
• In the coming session, index is likely to witness soft opening tracking muted global cues . We expect, index to sustain above 50 days EMA amid elevated global volatility . Hence, after initial decline use dip towards 39160 -39220 for creating long position for the target of 39515 , maintain a stop loss of 39030
To Read Complete Report & Disclaimer Click Here
Please refer disclaimer at https://secure.icicidirect.com/Content/StaticData/Disclaimer.html
SEBI Registration number INZ000183631
Above views are of the author and not of the website kindly read disclaimer


.jpg)