The daily strength indicator RSI is moving downwards and is quoting below - Axis Securities

Follow us Now on Telegram ! Get daily 10 - 12 important updates on Business, Finance and Investment. Join our Telegram Channel
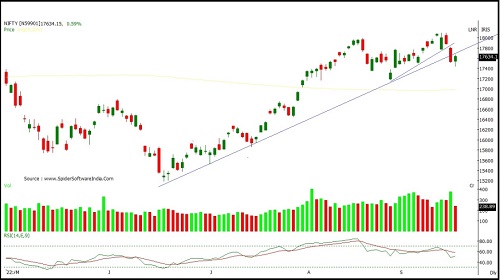
Nifty
Nifty opened on a flat note and witnessed extreme volatility on either side for most part of the session. Nifty closed at 17622 with a gain of 91 points. .
On the daily chart the index has formed a small bullish candle with shadows on either side representing extreme volatility. The index is moving in a Higher Top and Higher Bottom formation on the daily chart indicating a sustained up trend in medium term. Index broke below the upward sloping trend line in the previous day trade, whereas it is not able to take out 20 SMA placed at 17677 which is the crucial level to watch out for. The chart pattern suggests that if Nifty crosses and sustains above 17700 level it would witness buying which would lead the index towards 17800-17900 levels. Important Support for the day is around 17550 However if index sustains below 17550 then it may witness profit booking which would take the index towards 17450-17350 levels. Nifty is trading above 50, 100 and 200 day SMA indicating positive bias in the short to medium term. Nifty continues to remain in an uptrend for the short term, so buying on dips continues to be our preferred strategy.
The daily strength indicator RSI is moving downwards and is quoting below its reference line indicating negative bias.
The trend deciding level for the day is 17575. If NIFTY trades above this level then we may witness a further rally up to 17715-17810-17955 levels. However, if NIFTY trades below 17575 levels then we may see some profit booking initiating in the market, which may correct up to 17480-17335-17240 levels.
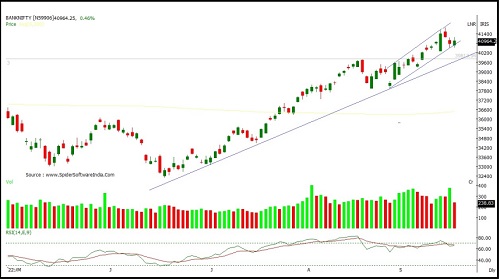
Bank nifty
Banknifty opened with a downward gap and traded with extreme volatility on either side. Banknifty closed at 40904 with a gain of 128 points
On the daily chart the index has formed a small bullish candle with shadows on either side representing extreme volatility as well as indecisiveness amongst participants regarding the direction. Index is holding lower band of rising channel. Breaking and sustaining below the lower band of the rising channel will open down side and if index hold the lower band of the channel it can rally towards upper band. The index is moving in a Higher Top and Higher Bottom formation on the daily chart indicating a short term up trend. The chart pattern suggests that if Banknifty crosses and sustains above 41050 level it would witness buying which would lead the index towards 41200-41500 levels. Important Support for the day is around 40850 However if index sustains below 40850 then it may witness profit booking which would take the index towards 40700-40x levels.. Banknifty is sustaining above its 20, 50, 100 and 200 day SMA which signals bullish sentiments in near term. Banknifty continues to remain in an uptrend in the medium and long term, so buying on dips continues to be our preferred strategy.
The daily strength indicator RSI continues to remain flat and is below its reference line indicating absence of momentum on either side
The trend deciding level for the day is 40865. If BANK NIFTY trades above this level then we may witness a further rally up to 41220-41540-41895 levels. However, if BANK NIFTY trades below 40865 levels then we may see some profit booking initiating in the market, which may correct up to 40550- 40190-39875 levels
To Read Complete Report & Disclaimer Click Here
For More Axis Securities Disclaimer https://simplehai.axisdirect.in/disclaimer-home
SEBI Registration number is INZ000161633
Views express by all participants are for information & academic purpose only. Kindly read disclaimer before referring below views. Click Here For Disclaimer


More News

Index is likely to open on a flattish note today and is likely to remain positive during the...