The daily price action formed a bull candle with a long lower shadow - ICICI Direct

Follow us Now on Telegram ! Get daily 10 - 12 important updates on Business, Finance and Investment. Join our Telegram Channel
https://t.me/InvestmentGuruIndiacom
Download Telegram App before Joining the Channel
Technical Outlook
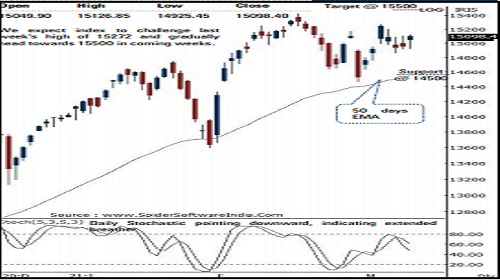
* The daily price action formed a bull candle with a long lower shadow, indicating elevated support base at 14900 as the fag end buying demand helped the index to recover 200 points from the day’s low (14925). Key point to highlight over past three sessions is that the index has managed to hold the intermediate support of 14900 despite volatile global cues, highlighting inherent strength
* Going ahead, we expect the index to challenge last week’s high of 15272 and gradually head towards 15500 in coming weeks. The revived traction in banking and IT sector would drive the index higher as together it carries 55% weightage in the benchmark. Therefore, capitalising on dips as an incremental buying opportunity in quality large caps would be the prudent strategy to adopt as the broader positive structure remains intact
* The broader market has taken a breather after recent outperformance and is currently performing in tandem with the benchmark. However, we expect broader markets to maintain the positive correlation with their global peers and accelerate the relative outperformance. Currently, Nifty midcap index is hovering around 52 weeks EMA. Meanwhile, small cap index is still 14% away from its life-time highs. Hence, we expect small caps to witness catch up activity within broader market space
* Structurally, the elevated buying demand in the vicinity of 50 days EMA helped the index to form a higher base, which we do not expect to be breached. Hence, any temporary breather from here on on should be used as incremental buying opportunity as support base of 14500 is confluence of a) since May 2020, the index has not sustained below its 50 days EMA. Currently, the 50 days EMA is placed at 14545, b) the 50% retracement of February rally (13597-15432), at 14514 and c) the past two week’s panic low is placed at 14468
NSE Nifty Daily Candlestick Chart
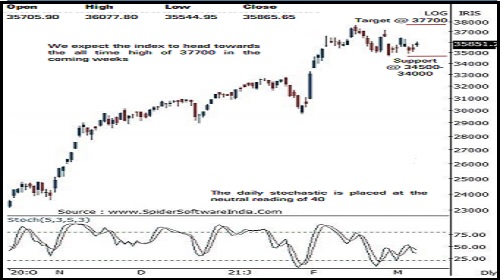
Bank Nifty: 35865
Technical Outlook
* The daily price action formed a bull candle which maintained higher high -low signalling positive bias . A follow through strength above Tuesday high (36077 ) will open upside towards 36500 levels in the coming sessions being the upper band of the last two weeks breather .
* Going ahead, in the short term we expect the index to maintain positive bias and retest its all time high of 37700 in the coming weeks .
* The index over the past 16 sessions has retraced just 38 . 2 % of preceding 13 sessions sharp up move (29688 -37708), at 34645 . The slower pace of retracement signifies healthy retracement and a higher base formation for the next leg of up move .
* The recent healthy retracement has helped the index to cool off the overbought conditions of weekly stochastic oscillator (currently at 59 ) . Therefore, the current breather should not be seen as negative and should be capitalised on as incremental buying opportunity, as we do not expect the index to breach the revised key support of 34500 -34000 as it is confluence of : a) The 38 . 2 % retracement of the budget rally (29687 -37708 ) placed at 34645 levels b) The recent panic low is also placed at 34658 levels
* In the coming session, the index is likely to open on a positive note on the back of strong global cues . volatility would remain high owing to the weekly expiry . We expect the index to trade with positive bias while maintaining higher high -low . Hence after a positive opening use intraday dips towards 35920 - 35980 for creating intraday
Bank Nifty Index – Daily Candlestick Chart
To Read Complete Report & Disclaimer Click Here
https://secure.icicidirect.com/Content/StaticData/Disclaimer.html
Views express by all participants are for information & academic purpose only. Kindly read disclaimer before referring below views. Click Here For Disclaimer


Tag News

Stock Picks : TCS Ltd And Chambal Fertiliser Ltd By ICICI Direct


More News

India VIX ended 1.20% down @ 23.03 against the previous close of 23.31 - GEPL Capital