The daily price action formed a bear candle carrying lower high-low, indicating extended breather - ICICI Direct

Follow us Now on Telegram ! Get daily 10 - 12 important updates on Business, Finance and Investment. Join our Telegram Channel
NSE(Nifty): 14906
Technical Outlook
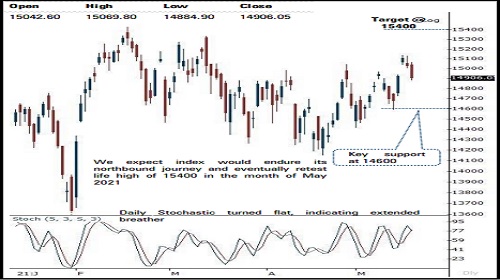
* The daily price action formed a bear candle carrying lower high-low, indicating extended breather. In the process, index filled Tuesday’s gap area of (14923-15044).
* Going ahead, we maintain our positive stance on the market and expect Nifty to head towards 15400 in the month of May 2021. We believe, the index is undergoing healthy retracement as over past two sessions it retraced 50% of preceding two sessions sharp up move (~550 points). The shallow price correction on the smaller degree chart highlights inherent strength. Therefore, extended breather from hereon should not be construed as negative instead it should be capitalized as incremental buying opportunity in quality large cap and mid-caps
* Broader market relatively outperformed the benchmark wherein Nifty small cap index recorded a fresh 52 weeks high. The broader market outperformance highlights inherent strength of the market that augurs well for durability of the ongoing up trend. We expect, Nifty midcap and small cap to accelerate their relative outperformance wherein catch up activity would be seen in small cap index, as Nifty midcap index is hovering around all time high whereas small cap index is still 6% away from life highs
* Structurally, the formation of higher high-low on the weekly chart signifies elevated buying demand that makes us believe the key support is placed at 14600 as it is confluence of
* a) 61.8% retracement of current up move (14151-15137), at 14530
* b) last week’s low is placed at 14592
* In the coming session, Nifty future is likely to open on a positive note tracking firm global cues. Since march 2021, index has not corrected for more than 2-3 sessions in a row. In current scenario as index has already corrected for more than 2 consecutive sessions we expect index to maintain this rhythm. Hence, use intraday dip towards 14940-14967 to create fresh long for target of 15057
NSE Nifty Daily Candlestick Chart
Nifty Bank: 33334
Technical Outlook
* The daily price action formed a bear candle with a lower high - low signalling profit booking for a second consecutive session after the strong up move of the preceding two sessions highlighting breather
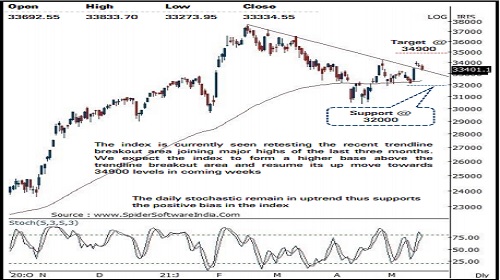
* The index is currently seen retesting the recent trendline breakout area joining major highs of the last three months . We expect the index to form a higher base above the trendline breakout area and resume its recent up move . The index is expected to head towards our medium term target of 34900 levels in the coming weeks as it is the 61 . 8 % retracement of the entire recent decline (37708 -30405 )
* We believe, a breather after faster pace of retracement (on the smaller degree chart) signifies healthy retracement that would set the stage for next leg of up move . Therefore, the current breather should be used as incremental buying opportunity in quality banking stocks
* The index has support at 32000 levels being the confluence of the last two weeks low and the 61 . 8 % retracement of the previous up move (30405 -34287 )
* The index has maintained the rhythm of not correcting more than 20 % as witnessed since March 2020 . In the current scenario, it rebounded after correcting 19 % from the all -time high (37708 ) . Hence it provides favourable risk -reward setup for the next leg of up move
* In the coming session, the index is likely to open on a positive note amid firm global cues . We expect the index to sustain above the recent trendline breakout area and trade with positive bias . Hence after a positive opening use dips towards 33410 -33480 for creating long position for the target of 33740 , maintain a stoploss of 33290
Nifty Bank Index – Daily Candlestick Chart
To Read Complete Report & Disclaimer Click Here
https://secure.icicidirect.com/Content/StaticData/Disclaimer.html
Views express by all participants are for information & academic purpose only. Kindly read disclaimer before referring below views. Click Here For Disclaimer


Tag News

Stock Picks : TCS Ltd And Chambal Fertiliser Ltd By ICICI Direct