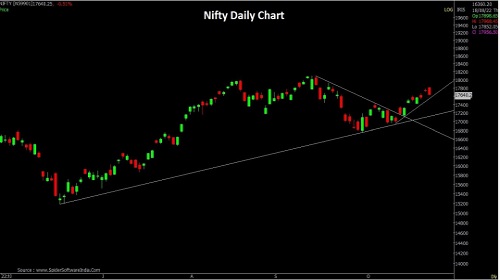
The chart pattern suggests that if Nifty crosses and sustains above 17815 - Jainam Share Consultants

Follow us Now on Telegram ! Get daily 10 - 12 important updates on Business, Finance and Investment. Join our Telegram Channel
https://t.me/InvestmentGuruIndiacom
Download Telegram App before Joining the Channel
Nifty
Nifty opened with an upward gap but witnessed selling from the opening tick to end near the day's low. Nifty closed at 17656 with a loss of 74 points. On the daily chart the index has formed a Bearish Marubozu candlestick pattern. it is formed when the price opens at a certain point and keeps falling and have a long body with small or no shadow. For such formations confirmation is necessary, so if the index breaks below previous day's low it would witness a change of trend to the downside. The chart pattern suggests that if Nifty crosses and sustains above 17815 level it would witness buying which would lead the index towards 17900-18000 levels. However if index breaks below 17630 level it would witness selling which would take the index towards 17580- 17500.
To Read Complete Report & Disclaimer Click Here
Please refer disclaimer at https://jainam.in/
SEBI Registration No.: INZ000198735, Research Analyst: INH000006448, PMS: INP000006785
Views express by all participants are for information & academic purpose only. Kindly read disclaimer before referring below views. Click Here For Disclaimer


Tag News

Nifty opened with an upward gap and witnessed consolidation for most part of the session - J...