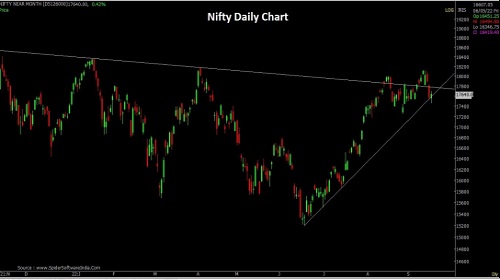
The chart pattern suggests that if Nifty crosses and sustains above 17670 level - Jainam Share Consultants

Follow us Now on Telegram ! Get daily 10 - 12 important updates on Business, Finance and Investment. Join our Telegram Channel
https://t.me/InvestmentGuruIndiacom
Download Telegram App before Joining the Channel
Nifty
Nifty opened on a flat note but buying led the index upwards to end in the green. Nifty closed at 17622 with a gain of 91 points. On the daily chart the index has formed a small Bullish candle carrying long lower shadow indicating buying support at lower levels. The chart pattern suggests that if Nifty crosses and sustains above 17670 level it would witness buying which would lead the index towards 17820-17900 levels. However if index breaks below 17420 level it would witness selling which would take the index towards 17380-17160.
To Read Complete Report & Disclaimer Click Here
Please refer disclaimer at https://jainam.in/
SEBI Registration No.: INZ000198735, Research Analyst: INH000006448, PMS: INP000006785
Views express by all participants are for information & academic purpose only. Kindly read disclaimer before referring below views. Click Here For Disclaimer


Tag News

Nifty opened with an upward gap and witnessed consolidation for most part of the session - J...


More News

The market is expected to continue on bullish momentum based on current price action - Enric...