The Nifty trend deciding level for the day is 16195 - Axis Securities

Follow us Now on Telegram ! Get daily 10 - 12 important updates on Business, Finance and Investment. Join our Telegram Channel
https://t.me/InvestmentGuruIndiacom
Download Telegram App before Joining the Channel
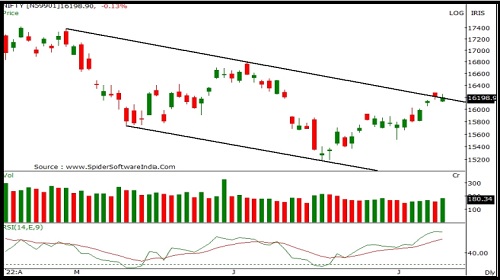
Nifty
Nifty opened sharply lower with a downward gap however buying support at lower levels recovered most of the earlier losses. Nifty closed at 16216 with a loss of 5 points. On the daily chart the index has formed a small bullish candle with upper shadow indicating selling pressure as well as resistance at higher levels. The index is moving in a Higher Top and Higher Bottom formation on the daily chart indicating an up trend. The chart pattern suggests that if Nifty crosses and sustains above 16300 level it would witness buying which would lead the index towards 16400-16500 levels. However if the index breaks below 16100 level it would witness selling which would take the index towards 16000-15900. Nifty is trading above its 20 and 50 day SMA which indicates positive bias in the short term. Nifty continues to remain in an uptrend for the short term, so buying on dips continues to be our preferred strategy. The daily strength indicator RSI has turned positive from the oversold territory and is above its reference line indicating positive bias. The trend deciding level for the day is 16195. If NIFTY trades above this level then we may witness a further rally up to 16270-16325-16405 levels. However, if NIFTY trades below 16195 levels then we may see some profit booking initiating in the market, which may correct up to 16140-16060-16005 levels.
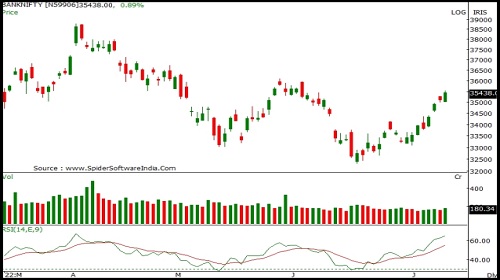
Bank Nifty
Banknifty opened sharply lower with a downward gap and extended buying momentum in the first half however we witnessed profit booking in the later half of the day. Banknifty closed at 35470 with a gain of 346 points. On the daily chart index has formed a bullish candle and has closed above its previous session's high representing positive bias ahead. The index is moving in a Higher Top and Higher Bottom formation on the daily chart indicating a short term up trend. The chart pattern suggests that if Banknifty crosses and sustains above 35500 level it would witness buying which would lead the index towards 35800-36000 levels. However if the index breaks below 35300 level it would witness selling which would take the index towards 35000-34800. Banknifty is trading above 20, 50 and 100 day SMA's indicating positive bias in the short to medium term. Banknifty continues to remain in an uptrend in the short term, so buying on dips continues to be our preferred strategy. The daily strength indicator RSI is moving upwards and is above its reference line indicating positive bias. The trend deciding level for the day is 35340. If BANK NIFTY trades above this level then we may witness a further rally up to 35675-35875-36210 levels. However, if BANK NIFTY trades below 35340 levels then we may see some profit booking initiating in the market, which may correct up to 35135-34805-34600 levels
To Read Complete Report & Disclaimer Click Here
For More Axis Securities Disclaimer https://simplehai.axisdirect.in/disclaimer-home
SEBI Registration number is INZ000161633
Views express by all participants are for information & academic purpose only. Kindly read disclaimer before referring below views. Click Here For Disclaimer


More News

Index Futures to the tune of 644 crores and were Sellers in Index Options to the tune of 512...