The Nifty trend deciding level for the day is 15455 - Axis Securities

Follow us Now on Telegram ! Get daily 10 - 12 important updates on Business, Finance and Investment. Join our Telegram Channel
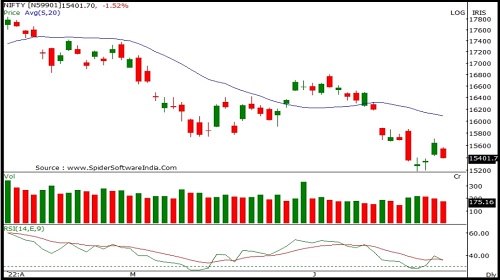
Nifty
Nifty opened sharply lower with a downward gap and selling pressure throughout the session dragged it lower to close near the day's low. Nifty closed at 15413 with a loss of 226 points. On the daily chart the index has formed a sizable bearish candle and has closed below previous session's low indicating negative bias.The index is moving in a Lower Top and Lower Bottom formation on the daily chart indicating negative bias. The chart pattern suggests that if Nifty crosses and sustains above 15500 level it would witness buying which would lead the index towards 15600-15700 levels. However if index breaks below 15350 level it would witness selling which would take the index towards 15200-15100. Nifty is trading below 20 day SMA indicating negative bias in the short to medium term. Nifty continues to remain in a downtrend in the short to medium term, so selling on rallies continues to be our preferred strategy. The daily strength indicator RSI has turned flat indicating absence of strength on the eitherside. The trend deciding level for the day is 15455. If NIFTY trades above this level then we may witness a further rally up to 15525-15635-15705 levels. However, if NIFTY trades below 15455 levels then we may see some profit booking initiating in the market, which may correct up to 15345-15275-15165 levels.
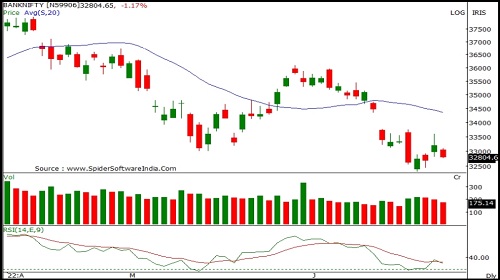
Bank Nifty
Banknifty opened with a downward gap and selling pressure throughout the session led it to close near day's low. Banknifty closed at 32845 with a loss of 346 points. On the daily chart the index has formed a sizable bearish candle and violated previous session's low indicating further weakness. The index is moving in a Lower Top and Lower Bottom formation on the daily chart indicating negative bias. The chart pattern suggests that if Banknifty crosses and sustains above 33000 level it would witness buying which would lead the index towards 33300-33600 levels. However if the index breaks below 32700 level it would witness selling which would take the index towards 32500-32200. Banknifty is trading below 20, 50, 100 and 200 day SMA indicating negative bias in the short to medium term. Banknifty continues to remain in a downtrend in the short to medium term, so selling on rallies continues to be our preferred strategy. The daily strength indicator RSI has turned flat indicating absence of strength on the either side. The trend deciding level for the day is 32905. If BANK NIFTY trades above this level then we may witness a further rally up to 33050-33250-33400 levels. However, if BANK NIFTY trades below 32905 levels then we may see some profit booking initiating in the market, which may correct up to 32700-32555-32350 levels.
To Read Complete Report & Disclaimer Click Here
For More Axis Securities Disclaimer https://simplehai.axisdirect.in/disclaimer-home
SEBI Registration number is INZ000161633
Views express by all participants are for information & academic purpose only. Kindly read disclaimer before referring below views. Click Here For Disclaimer


More News

Perspective on markets By Mr. Jaykrishna Gandhi, Emkay Global Financial Services