The Nifty started the F&O expiry session on a positive note and broadly moved in a 100-points range - ICICI Direct

Follow us Now on Telegram ! Get daily 10 - 12 important updates on Business, Finance and Investment. Join our Telegram Channel
NSE (Nifty): 15338
Technical Outlook
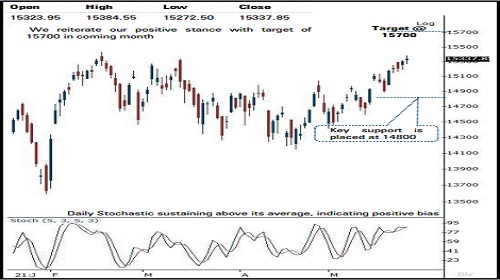
* The Nifty started the F&O expiry session on a positive note and broadly moved in a 100-points range throughout the session. Consequently, daily price action formed a high wave candle, indicating elevated volatility near lifetime highs and amid expiry. Despite this, the index maintained its positive stance by way of higher high-low and ended the session at record highs
* Going forward, we reiterate our positive stance with target of 15700 in coming month. Elevated volatility near lifetime highs (after ~800 points rally in past say nine sessions,) should not be a cause of concern. The broad based participation backed by improving market breadth signifies rejuvenation of up trend that supports our positive stance with revised target of 15700 in June, as it is 123.6% external retracement of February-April correction (15432-14151). Hence, any temporary cool off from here on should be capitalised on as incremental buying opportunity in quality large cap, midcaps
* The intermediate shallow corrections followed by elongated up trend highlights structural improvement. Key point to highlights during current up move off May low (14416) is that, the market breadth has improved as 86% components of Nifty 500 index are trading above 50 days EMA compared to April reading of 60%. This augurs well for durability of ongoing up trend
* The broader market maintained their relative outperformance wherein Nifty small cap index recorded fresh 52 weeks high. The outperformance in the broader market indices has been backed by improving market breadth as currently ~84% of index components are trading above their 50 days EMA compared to April reading of ~60%. We expect catch up activity to be seen in small cap index, as Nifty Midcap index is placed at all time high whereas small cap index is 3% away from lifetime highs
* Structurally, the formation of higher high-low signifies elevated buying demand that makes us confident to revise support base at 14800 as it is confluence of:
* a) 80% retracement of past 3 weeks rally (14592-15385), at 14750
* b) 50 days EMA is placed at 14798
* In the coming session, index is likely to open on a buoyant note tracking frim global cues. We expect the index to trade with a positive bias as over past five sessions intraday pullback have been bought into. Hence, use intraday dip towards 15400-15430 to create long for target of 15515
NSE Nifty Daily Candlestick Chart
Nifty Bank: 35095
Technical Outlook
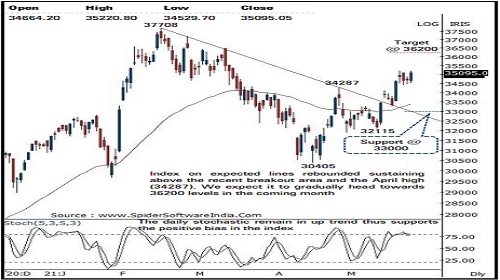
* The daily price action formed a bull candle with a higher high - low signalling continuation of the up move after last two sessions of breather . The index on expected lines rebounded sustaining above the recent breakout area and the April high (34287) signalling strength.
* Key observation is that the index since April has maintained the rhythm of not correcting for more than two to three sessions, in the current scenario also the index rebounded after two sessions of breather .
* Extended rally and shallow correction highlights positive price structure . We expect the index to maintain positive bias and head towards 36200 levels in the coming month as it is the confluence of the 80 % retracement of the entire last three months corrective decline (37708 -30405 ) and the price parity with previous up move (30405 -34287 ) as projected from the recent trough of 32115 signalling upside towards 36200 levels
* As mentioned in earlier edition the index has recently registered a breakout above the falling supply line joining major highs of the last three months as can be seen in the adjacent chart highlighting resumption of the primary up trend
* The formation of higher high -low on the weekly chart signifies elevated buying demand that makes us assured to revise the support base higher towards 33000 levels as it is confluence of the 61 . 8 % retracement of the current up move (32115 -35216 ) and the rising 50 days EMA is also placed at 33230 levels
* Among the oscillators the daily stochastic remain in up trend and is currently placed at a reading of 78 thus supports the positive bias in the index
* In the coming session, the index is likely to open on a positive note amid firm global cues . We expect the index to trade with positive bias and maintain higher high -low . Hence after a positive opening use dips towards 35290 -35350 for creating long position for the target of 35620 , maintain a stoploss of 35160
Nifty Bank Index – Daily Candlestick Chart
To Read Complete Report & Disclaimer Click Here
https://secure.icicidirect.com/Content/StaticData/Disclaimer.html
Views express by all participants are for information & academic purpose only. Kindly read disclaimer before referring below views. Click Here For Disclaimer


Tag News

Stock Picks : TCS Ltd And Chambal Fertiliser Ltd By ICICI Direct


More News

Market is expected to open gap up and likely to witness positive move during the day - Nirm...