The Nifty midcap and small cap indices extended correction in the vicinity of key long term average of 52 weeks EMA - ICICI Direct

Follow us Now on Telegram ! Get daily 10 - 12 important updates on Business, Finance and Investment. Join our Telegram Channel
https://t.me/InvestmentGuruIndiacom
Download Telegram App before Joining the Channel
Nifty
Technical Outlook
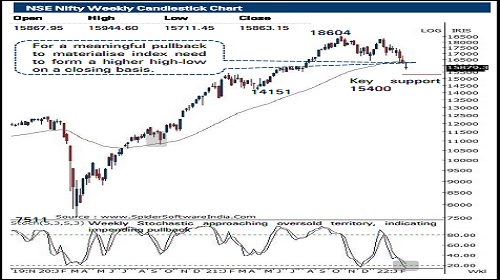
The index witnessed a gap down opening below its 52 weeks EMA in Monday’s session and drifted towards ~15700. However, supportive efforts at lower levels that helped index to recover some of its lost ground and eventually closed above the key support of 15800. The daily price action formed a doji candle, highlighting elevated volatility amid rise in geopolitical jitters.
The formation of lower high-low signifies continuance of corrective bias. Key point to highlight is that, over past ten sessions index has dipped 10% that hauled weekly stochastic oscillator in oversold territory currently placed at 14. Thus, traders should avoid creating aggressive short position at current juncture. However, for a meaningful pullback to materialise index need to form a higher high-low on a closing basis.
On the contrary, a decisive breach below immediate support of 15800 would lead to prolongation of correction towards 15400 in coming weeks as it is confluence of:
a) 61.8% retracement of CY-21 rally (13596-18604), at 15510
b) over past two decades, the average correction post breach of 52 weeks EMA has been 5%, which will mature around 15400 in current scenario
The Nifty midcap and small cap indices extended correction in the vicinity of key long term average of 52 weeks EMA. We expect broader market would relatively underperform the benchmark in coming weeks
In the coming session, index is likely to open on a on a soft note tracking subdued global cues. As the index has approached oversold territory. We expect supportive efforts to emerge from lower levels. Thus any pullback towards 15692-115725 should be used to create long position for target of 15810
Nifty Bank
Technical Outlook
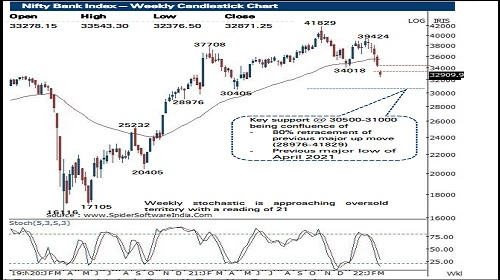
The daily price action formed a sizable bear candle with a lower high -low and a bearish gap above its head (34094 - 33543 ) signalling continuation of the corrective decline . The index need to start forming higher high -low in the daily chart on a sustained basis and close above Monday’s gap down area (34094 -33543 ) for any technical pullback to materialise
The index after sharp decline of almost 15 % in just two weeks has approached oversold territory with a daily stochastic reading of 13 . Hence, holding above Monday’s panic low of (32376 ) a technical pullback can not be ruled out towards Friday’s high of 35100 levels in the coming week
The index has key support around 30500 -31000 levels being the confluence of the following :
(a) 80 % retracement of the previous major rally of December 2020 -October 2021 (28976 -41829 )
(b) previous major low of April 2021 is also placed at 30405 levels
Among the oscillators the daily stochastic remain in downtrend and is currently placed in oversold territory with a reading of 13 , thus supportive effort is likely at lower levels in the coming sessions
In the coming session, index is likely to open on a negative note amid weak global cues . Volatility is likely to remain high on account of geo -political concerns . However, we expect index to attempt a pullback forming base near Monday’s low (32450 ) . Hence use dips towards 32400 -32480 for creating long position for target of 32740 , maintain a stop loss at 32290
To Read Complete Report & Disclaimer Click Here
https://secure.icicidirect.com/Content/StaticData/Disclaimer.html
Views express by all participants are for information & academic purpose only. Kindly read disclaimer before referring below views. Click Here For Disclaimer


Tag News

Stock Picks : TCS Ltd And Chambal Fertiliser Ltd By ICICI Direct


More News

Nifty weekly contract has highest open interest at 18500 for Calls and 17900 for Puts - Geoj...