Prolonged consolidation amid stock specific action - ICICI Direct

Follow us Now on Telegram ! Get daily 10 - 12 important updates on Business, Finance and Investment. Join our Telegram Channel
Prolonged consolidation amid stock specific action
Technical Outlook
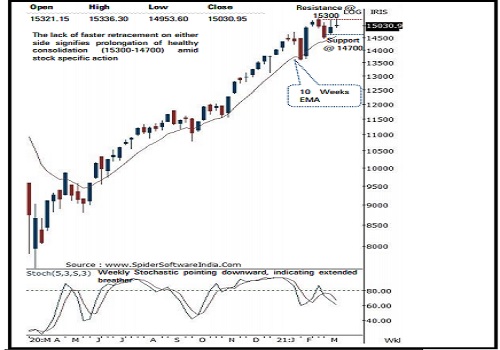
* Equity benchmarks extended gains over second consecutive week supported by buoyant global cues. The Nifty concluded the week at 15031, up 0.6%. Small cap index relatively outperformed by gaining 1.4%. Sectorally, IT and financials outshone while auto, FMCG and realty took a breather
* The weekly price action formed a high wave candle carrying higher high-low, indicating elevated volatility amid positive bias
* Key point to highlight is that, over past nine sessions index has retraced 80% of preceding nine sessions decline (15432-14468). The lack of faster retracement on either side signifies prolongation of healthy consolidation (15300-14700) amid stock specific action that will help index to form a higher base above key support threshold of 14700. In the process, we expect broader markets to continue with its relative outperformance. Hence, dips should be capitalized as incremental buying opportunity in quality large caps and midcaps stock
* Key point to highlight globally is that, developed markets have resolved out of past two months consolidation backed by faster pace of retracement on the smaller degree charts, indicating revived upward momentum. We expect, positive correlation to play out in the domestic market as well, paving the way towards life highs of 15430 in coming weeks.
* The broader markets have endured their relative outperformance, since Nifty midcap and small cap indices have rallied 4% and 5%, respectively as of now in the March 2020, compared to Nifty which is up 3%. The broader market resilience has been backed by strengthening of market breadth as currently ~76% of Nifty midcap and small cap components are sustaining well above their 50 days EMA compared to February reading of 72%. The sustenance above 50 days EMA signifies inherent strength that augurs well for durability of ongoing relative outperformance.
* On the sectoral front, IT, Consumption, BFSI, Infra to relatively outperform. We maintain positive stance on Infosys, Indusind Bank, Titan, Persistent, L&T Infotech, Tata Chemicals, Ajantha Pharma, Thermax, Mahindra Logistics, KPR Mills among others
* Structurally, the formation of higher peak and trough on the larger degree chart signifies inherent strength that makes us confident to revise support base at 14700 as it is confluence of a) The 80% retracement of past two weeks up move (14468-15336), at 14642 b) Last week’s low is placed at 14639 In the coming session, Nifty future is likely to open with a positive gap tracking firm global cues. We expect the index to hold Friday’s low (Spot-14954) and trade with a positive bias. Hence, use intraday dip towards 15022-15055 to create long position for target of 15139.
NSE Nifty Weekly Candlestick Chart
Nifty Bank: 35496
Technical Outlook
* The Nifty Bank index closed higher for the second consecutive week up by 0 . 8 % amid firm global cues despite profit booking on Friday session . Private banking stock lead the positive momentum while the PSU bank index closed lower for the third consecutive week . The Bank Nifty ended the week at 35496 up by 268 points or 0 . 8 %
* The weekly price action formed a Doji candle carrying higher high -low, indicating range bound trade amid elevated volatility . Index witnessed profit booking on Friday session as the index gave up most of its weekly gains and closed marginally higher .
* Going ahead, we expect the index to extend ongoing healthy consolidation in the range of 34500 -36500 amid stock specific action . Only a closing above 36500 will lead to acceleration of the up move towards the all time high of 37700 in the coming weeks
* The index over the past 18 sessions has retraced just 38 . 2 % of preceding 13 sessions sharp up move (29688 -37708), at 34645 . The slower pace of retracement signifies healthy retracement and a higher base formation for the next leg of up move .
* The recent healthy retracement has helped the index to cool off the overbought conditions of weekly stochastic oscillator (currently at 57 ) . Therefore, the current breather should not be seen as negative and should be capitalised on as incremental buying opportunity, as we do not expect the index to breach the revised key support of 34500 -34000 as it is confluence of : a) The 38 . 2 % retracement of the budget rally (29687 -37708 ) placed at 34645 levels b) The recent panic low is also placed at 34658 levels c) The rising 50 days EMA placed around 34100 levels
* In the coming session, the index is likely to open flat to positive on back of firm Asian cues . We expect the index to trade in a range with positive bias . Hence use dips towards 35260 -35320 for creating intraday long for the target of 35540 , maintain a stoploss at 35140
Nifty Bank Index – Weekly Candlestick Chart

To Read Complete Report & Disclaimer Click Here
https://secure.icicidirect.com/Content/StaticData/Disclaimer.html
Views express by all participants are for information & academic purpose only. Kindly read disclaimer before referring below views. Click Here For Disclaimer




Tag News

Stock Picks : TCS Ltd And Chambal Fertiliser Ltd By ICICI Direct


