On the daily scale the occurrence of a dual combination of candlestick reversal formations - Tradebulls Securities

Nifty
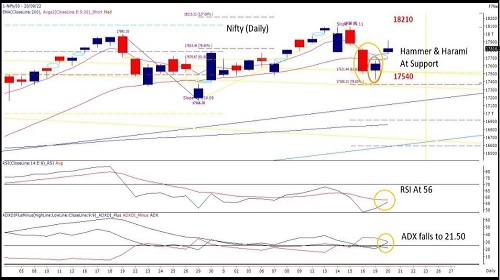
On the daily scale the occurrence of a dual combination of candlestick reversal formations viz. the ‘Bullish Hammer’ &alsoaprominent‘Bullish Harami’ reconfirms the support at 17540-17450 zone. Occurrence of these patterns was a strong sign of a possiblefollowthrough move which unfolded on time which helped the index to surface back above its 5 & 20 DEMA zone resistance levels. Thepriorwaves intensity of the decline remains critical as index breached & engulfed its 6 days price action within 1.5 days itself sendingjittersinthe mind of investors & traders. Hence the recovery also should be significant in case the index needs to re-counter the movetowards18100. On the oscillator front both its trend strength indicators are displaced now with RSI hovering at 56 while ADX has fallenbelow25which indicates lack of conviction for a follow through up move. As per the weekly data set it looks like a ranged price actionwithin17850-17500 zone traders should refrain from building aggressive positions on either during the week & wait for more claritytoemergepost this weekly close. A follow through close above 17800 could evoke the upside move towards 18210 ; while a sustainedclosingbelow 17400 could push the index towards 17000.
To Read Complete Report & Disclaimer Click Here
Please refer disclaimer at https://www.tradebulls.in/disclaimer
SEBI Registration number is INZ000171838
Views express by all participants are for information & academic purpose only. Kindly read disclaimer before referring below views. Click Here For Disclaimer