On the daily chart index has formed a bullish candle forming higher High-low compared to previous session - Axis Securities

Follow us Now on Telegram ! Get daily 10 - 12 important updates on Business, Finance and Investment. Join our Telegram Channel
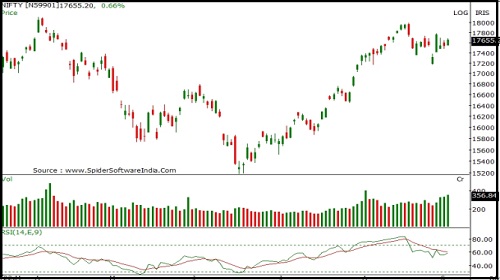
Nifty
Nifty opened with an upward gap and buying momentum throughout these session led it to close in a positive terrain. Nifty closed at 17666 with a gain of 126 points.
On the daily chart index has formed a bullish candle forming higher High-low compared to previous session indicating positive bias. The index is moving in a Higher Top and Higher Bottom formation on the daily chart indicating an up trend. The chart pattern suggests that if Nifty crosses and sustains above 17700 level it would witness buying which would lead the index towards 17800-17900 levels. However if the index breaks below 17600 level it would witness selling which would take the index towards 17500-17400. Nifty is trading above its 20, 50 , 100 and 200 day SMA which indicates positive bias in the short term. Nifty continues to remain in an uptrend for the short term, so buying on dips continues to be our preferred strategy.
The daily strength indicator RSI is moving downwards and is quoting below its reference line indicating negative bias.
The trend deciding level for the day is 17630. If NIFTY trades above this level then we may witness a further rally up to 17720-17775-17860 levels. However, if NIFTY trades below 17630 levels then we may see some profit booking initiating in the market, which may correct up to 17575-17485-17435 levels.
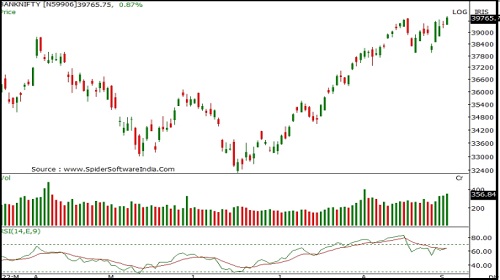
Banknifty
Banknifty opened with an upward gap and remained in positive terrain throughout the day. Banknifty closed at 39806 with a gain of 385 points.
On the daily chart index has formed a bullish candle and has closed above its previous session's high representing positive bias ahead. The index is moving in a Higher Top and Higher Bottom formation on the daily chart indicating a short term up trend. The chart pattern suggests that if Banknifty crosses and sustains above 39900 levels it would witness buying which would lead the index towards 40200-40500 levels. However if the index breaks below 39600 level it would witness selling which would take the index towards 39400-39200. Banknifty is trading above 20, 50,100 and 200 day SMA indicating positive bias in the short to medium term. Banknifty continues to remain in an uptrend in the short term, so buying on dips continues to be our preferred strategy.
The daily strength indicator RSI is moving upwards and is above its reference line indicating positive bias.
The trend deciding level for the day is 39695. If BANK NIFTY trades above this level then we may witness a further rally up to 39980-40150-40435 levels. However, if BANK NIFTY trades below 39695 levels then we may see some profit booking initiating in the market, which may correct up to 39520-39235-39065 levels.
To Read Complete Report & Disclaimer Click Here
For More Axis Securities Disclaimer https://simplehai.axisdirect.in/disclaimer-home
SEBI Registration number is INZ000161633
Views express by all participants are for information & academic purpose only. Kindly read disclaimer before referring below views. Click Here For Disclaimer


More News

The daily price action formed a small bear candle carrying higher high-low, indicating conti...