

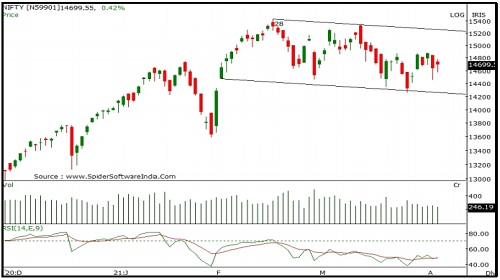
Nifty opened on a positive note and traded with extreme volatility throughout the session - Axis Securities

Nifty
Nifty opened on a positive note and traded with extreme volatility throughout the session.. Nifty closed at 14684 with a gain of 46 points. On the daily chart the index has formed a Bearish candle with a lower shadow indicating buying at lower levels. Since past couple of weeks index continue to consolidate in a broad trading range (14900-14300) representing sideways trend.
The chart pattern suggests that if Nifty crosses and sustains above 14800 level it would witness buying which would lead the index towards 14900-14950 levels. However if index breaks below 14600 level it would witness selling which would take the index towards 14500-14400.
Nifty is trading below 20 and 50 day SMA's which indicating negative bias in the short term. Nifty continues to remain in an uptrend in the medium and long term, so buying on dips continues to be our preferred strategy. The daily strength indicator RSI continues to remain flat and is below its reference line indicating absence of momentum on either side The trend deciding level for the day is 14680.
If NIFTY trades above this level then we may witness a further rally up to 14785-14885-14990 levels. However, if NIFTY trades below 14680 levels then we may see some profit booking initiating in the market, which may correct up to 14580-14475-14375 levels.
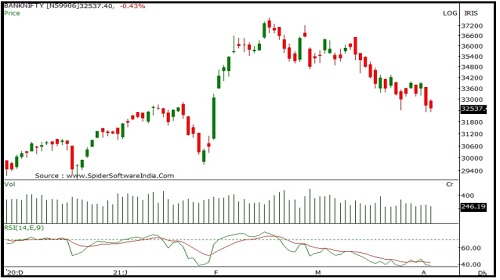
Banknifty
Banknifty opened with an upward gap but witnessed selling from the opening tick to end on a negative note. Banknifty closed at 32501 with a loss of 178 points. On the daily chart index has formed a bearish candle however it remained restricted within previous session's High-Low range indicating absence of strength on eitherside.
The index is moving in a Lower Top and Lower Bottom formation on the daily chart indicating negative bias. The chart pattern suggests that if Banknifty crosses and sustains above 33000 level it would witness buying which would lead the index towards 33300-33700 levels. However if index breaks below 32300 level it would witness selling which would take the index towards 32000- 31800.
Banknifty is trading below 20-day and 50-day SMA indicating negative bias in the short to medium term. Banknifty continues to remain in an uptrend in the medium and long term, so buying on dips continues to be our preferred strategy. The daily strength indicator RSI has turned negative from the overbought territory and is below its reference line indicating sustained downtrend. The trend deciding level for the day is 32615.
If BANK NIFTY trades above this level then we may witness a further rally up to 32895-33285-33560 levels. However, if BANK NIFTY trades below 32615 levels then we may see some profit booking initiating in the market, which may correct up to 32225-31945-31555 levels.
To Read Complete Report & Disclaimer Click Here
For More Axis Securities Disclaimer https://simplehai.axisdirect.in/disclaimer-home
SEBI Registration number is INZ000161633
Views express by all participants are for information & academic purpose only. Kindly read disclaimer before referring below views. Click Here For Disclaimer


Tag News
More News

Banking Index Gains 2.70% on Gap-Up Open, Extends Momentum - Religare Broking Ltd


