Monthly Equity View - July 23 by George Thomas, Fund Manager Equity

Below The Monthly Equity View – July 23 by George Thomas, Fund Manager – Equity
Equity Outlook – July 2023
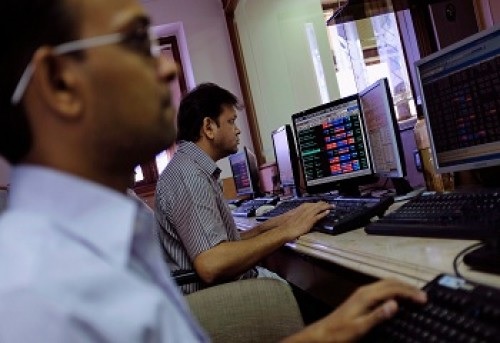
The S&P BSE Sensex rose by 3.6% in the month of June supported by strong FPI flows and reasonable macro. FPI flows have strengthened amidst India’s relative preference following weak recovery in China. S&P BSE Midcap Index & S&P BSE Small cap Index increased by 6.4% and 6.9% respectively. Moderating inflation and MPC’s decision to pause rate hikes also supported the rally. Mid and small cap companies had a relatively higher benefit from the moderation in input costs compared to larger peers. All sectoral indices advanced during the month in line with broader market trend. Healthcare, Auto, Capital Goods and Realty were sectors which advanced to a higher extent. Few pharma companies bagged product approvals aiding a better revenue visibility. Auto sales are progressing reasonably well. Rationalisation of subsidies has reduced the sales mix in favour of conventional engines benefiting the traditional auto players. Capital goods sector is benefiting from healthy order inflows and moderation in input prices. Residential absorption across top cities is showing healthy growth benefiting the listed developers. Global indices followed a similar trend on investor hopes of a potential reversal in rate cycle and normalisation in global macro environment. S&P 500 advanced by 6.6%, broader MSCI EM index advanced by 3.8% and MSCI World Index advanced by 6.1%. In terms of flows, FPI flows remain strong as India has a reasonable macro environment amidst the global uncertainties. Weak recovery in China is also helping the relative preference for India. FPI (Foreign Portfolio Investors) inflows for the month of June stood at USD 5.7 bn. DIIs (Domestic Institutional Investors) were buyers to the tune of USD 687 mn. Indian equities saw block deals to the tune of over $10 bn so far in 2023 compared to $ 14 bn in the whole of 2022. This is indicative of strong appetite for Indian equities. Quantum Long Term Equity Value Fund (QLTEVF) saw an increase of 4.7 % in its NAV in the month of June 2023. This compares to an increase of 4.3% in it’s Tier-I benchmark - S&P BSE 500 and 4.0% in it’s Tier-II Benchmark - S&P BSE 200. Auto and financials were major contributors to the outperformance. Cash in the scheme stood at approximately 6.9% at the end of the month. The portfolio is valued at 12.8x consensus earnings vs. the S&P BSE Sensex valuations of 17.5x based on FY25E consensus earnings; thus, displaying value characteristics.
Should Investors be wary of incremental investment at current levels?
PMI-Services and PMI-Manufacturing indices continues to be in the expansion zone at 58.5 and 57.8 respectively in June. As indicated by the PMI survey, employment expanded over the month indicative of reasonable demand expectation by companies. Provisional figures for Q1-FY24 reported by banks and NBFCs show a healthy credit demand for most companies. GST collections and auto sales are also showing a healthy trend. Monsoon is turning out to be better than initial fears of a large deficit due to El Nino. Corporate earnings cycle and macro environment continues to be conducive for a broad-based growth. There is a reasonable chance of normalisation in global macro over the course of next year which could further stimulate the current uptrend in corporate earnings. Nifty EPS growth indicated by consensus estimates corroborates a similar story.

Indices across market caps are trading marginally above long-term average valuations. Given the recent rally in mid and small caps, risk reward looks favourable in the large cap category. Quantum follows a liquidity filter of a minimum average daily turnover of $ 1 mn over past one year, leading to a large cap tilt in the portfolio. The liquidity filter is to ensure that the reported NAV (Net Asset Value) reflects the realisable value even during times of market down turns. The following graph shows draw downs (Fall from previous peak) across indices since Jan-2004. The small cap and mid cap indices which has a higher proportion of illiquid names has had larger draw downs and longer recovery times (Time to recoup losses).

The stable domestic macro environment and favorable corporate earnings cycle doesn’t indicate the possibility of a material correction in the broader markets. However, a deterioration in global macro, deficit monsoon leading to a spike in inflation or uncertainty around 2024 general elections could lead to short term volatility. Investors can consider making incremental investments in a staggered manner.
To Read Complete Report & Disclaimer Click Here
Above views are of the author and not of the website kindly read disclaimer


Tag News

We anticipate immense potential benefits from the upcoming Sovereign Gold Bond Tranche in FY...