Investors look forward to the August US non-farm payrolls data due later in the week for further direction - Kedia Advisory

Follow us Now on Telegram ! Get daily 10 - 12 important updates on Business, Finance and Investment. Join our Telegram Channel
https://t.me/InvestmentGuruIndiacom
Download Telegram App before Joining the Channel
HIGHLIGHTS
Gold prices were caught in a tight range as investors held off from making large bets as they prepared for key U.S. jobs data that could influence the Federal Reserve’s stimulus tapering strategy.
The dollar fell to its lowest level in more than three-weeks against a basket of currencies on Tuesday, as investors looked to U.S. jobs figures later this week for insight into the possible path of U.S. Federal Reserve monetary policy.
Last week, Fed Chair Jerome Powell acknowledged in his remarks at the Jackson Hole symposium that tapering could begin this year, but it will remain cautious in its decision to raise interest rates.
Indicative of sentiment, holdings of the SPDR Gold Trust , the world’s largest gold-backed exchange-traded fund, have fallen to their lowest level since April 2020.
Support also seen as data showing a contraction in China's services sector activity and a slower pace of expansion of the country's factory activity dented optimism about a strong economic rebound from the pandemic.
ECB policymaker Robert Holzmann said the central bank should start debating how it will phase out its pandemic-era stimulus. Inflation in the euro zone hit its highest level in almost a decade in August, according to an estimate from the EU's statistics office Eurostat.
Debt is rising in the US and volatility in U.S. yields and dollar continues to remain high suggesting that once should brace for heightened volatility in near future. Many Fed members continue to stick to their earlier comments but some have shown concerns regarding growing uncertainties thereby supporting metal prices.
Gold/Silver ratio is also one of the factors which justifies the move for silver, was once at the highs of 127 last year, is currently trading 75 levels. The spot gold-silver ratio stands at 75.88 to 1, indicating that gold has outperformed silver.
Investors look forward to the August US non-farm payrolls data due later in the week for further direction.
Goldman Sachs said in a note gold would continue to trade “moderately higher” on a weaker dollar and demand recovery in emerging markets. “For gold to move materially higher though, there has to be a general risk-off event which will trigger demand for defensive inflation hedges such as the return of inflation worries,” they said
Technical Chart :
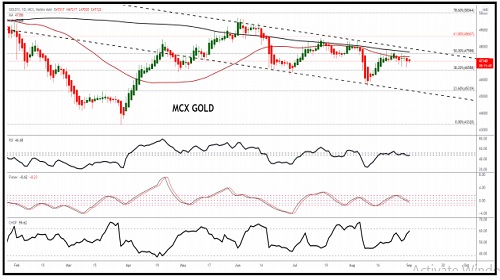
Gold price yesterday settled weak towards 47120 level holding very well 47000 level mark while prices approached the key support 46700.00, but the EMA50 managed to protect the price from achieving more decline, to rebound bullishly and head towards 47100 level, to continue moving inside the bullish channel that appears on the chart, some pressure seen as Rupee strengthen to test 73.11 level today. Right now prices are just below 200 dma which is at 47600 level traders are waiting to breach the last level to open the way to head towards 48300.00 that represents our next main target. Therefore, we will continue to suggest the bullish trend for the upcoming period unless breaking 46700.00 and holding below it. As per Daily Technical indicator RSI turning upwards from the 40-level, currently it is at 46.68 which suggests extended upside in the Gold prices for next few days, after crossing 52 it is expected to reach 60 RSI, which means fresh buying in Gold can be witnessed. Meanwhile, the choppiness indicator is at 59.62, showing low volatility in the price right now, this means that a sideways trend is quite likely in the near future, while tonight, the market shall pay attention to the US ADP job report for August which will give more clear direction.
OUTLOOK
1 Month View
Traders are advised to buy Gold on a break of 47600 level for target of 48300 and above same can test 48600 level view is valid as long as prices are holding above 46700 level.
To Read Complete Report & Disclaimer Click Here
Views express by all participants are for information & academic purpose only. Kindly read disclaimer before referring below views. Click Here For Disclaimer