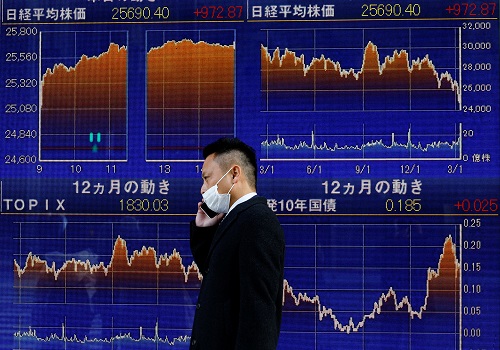
Indian markets could open higher, following largely positive Asian markets today and higher US markets on Thursday - HDFC Securities

Follow us Now on Telegram ! Get daily 10 - 12 important updates on Business, Finance and Investment. Join our Telegram Channel
Indian markets could open higher, following largely positive Asian markets today and higher US markets on Thursday - HDFC Securities
U.S. stocks finished higher Thursday, partially recovering from the worst one day sell off since October on Wednesday, as investors focused on earnings reports from big technology companies and positive economic data.
Investors also monitored volatile trading in shares of small-cap companies such as Gamestop, which later saw a halt to trading from brokerages, drawing the attention of lawmakers in Washington. All eleven S&P 500 index sectors rose Thursday, after all fell Wednesday, marking the first time that has occurred since Nov. 13 last year, as investors took heart from corporate earnings reports and data showing a slow economic recovery from the coronavirus pandemic.
In the US, a reading of those seeking initial jobless claims in the week ended Jan. 23, fell by 67,000 to a seasonally adjusted 847,000, marking the lowest level in three weeks. U.S. gross domestic product grew at a 4% annualized rate in the fourth quarter, in line with economists' forecasts, though for all of 2020 the economy contracted 3.5%, its worst performance since World War Two.
Silver prices rose about 7% as the dollar weakened, making the metal cheaper for buyers outside the United States. Japan’s industrial output extended declines in December as factories struggled with a hit to demand from expanded COVID19 lockdown measures globally, suggesting the economic recovery was slowing.
Official data released on Friday showed factory output declined 1.6% in December, larger than the previous month’s 0.5% fall. Stocks in Asia-Pacific were higher in Friday trade as shares in the US saw an overnight bounce from heavy losses suffered on Wednesday
Indian benchmark equity indices ended lower in the fifth consecutive session on January 28. Nifty opened gap down following overnight sharp weakness in the US markets and made a bottom at about 1305 Hrs.
A feeble recovery followed. At close, the Nifty was down 150 points or 1.07% at 13,817.50. The Nifty fell for the fifth consecutive session on Jan 28; however it did not close at the intra day lows. Pre budget buildup on a small scale may begin from Friday. 13713-13927 could be the band of support / resistance for the near term
Daily Technical View on Nifty
Observation: The sharp trended decline continued in the market for the fifth consecutive sessions on Thursday and Nifty closed the day lower by 149 points. After opening on a downside gap of 132 points, Nifty made failed attempt of upside bounce in the early mid part of the session.
The intraday weakness continued for the better part and upside recovery was observed in the afternoon to later part of the session amidst a range movement. The opening downside gap remains unfilled. A small positive candle was formed with gap down opening with upper and lower shadow. Technically, this pattern indicate a formation of doji or high wave type candle pattern.
Normally, a formation of such pattern after a reasonable decline or at the swing low could be a part of bullish reversal pattern after the confirmation. Hence, there is a possibility of an upside bounce from the lows. The negative formation of three black crows pattern is still intact on the daily chart, which signal a sharp reversal of previous uptrend of the market.
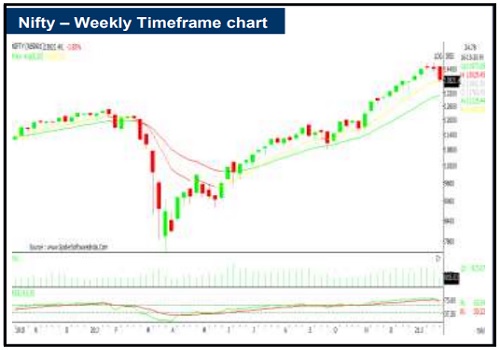
The Nifty on the weekly chart reached a crucial immediate support of 13750 (10 week EMA) and placed slightly higher. Previously, this moving average has offered support for the market during Oct-Nov 20 and in Dec 20. Hence, Nifty sustaining above this support could open chances of pre budget upside bounce in the market.
Conclusion: The short term trend of Nifty continues to be negative. But, having placed at the crucial support of 13750 (10 week EMA) and a formation of doji/high wave type pattern (on the daily chart) could hint at the possibility of upside bounce from the lower levels, post confirmation. A decisive move below 13750 is likely to negate this positive development and could lead towards further low of 13500. On the rise, the upper area of 13950-14000 could act as stiff resistance.
To Read Complete Report & Disclaimer Click Here
Please refer disclaimer at https://www.hdfcsec.com/article/disclaimer-1795
SEBI Registration number is INZ000171337
Views express by all participants are for information & academic purpose only. Kindly read disclaimer before referring below views. Click Here For Disclaimer






Tag News

Nifty registers best week in 2 months after rising for 6 consecutive sessions
