If NIFTY trades above this level then we may witness a further rally up to 17280-17445-17540 levels - Axis Securities

Follow us Now on Telegram ! Get daily 10 - 12 important updates on Business, Finance and Investment. Join our Telegram Channel
https://t.me/InvestmentGuruIndiacom
Download Telegram App before Joining the Channel
Nifty
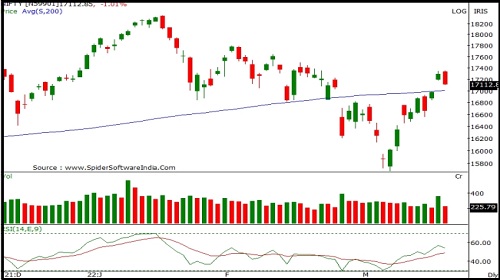
Nifty opened with an upward gap but witnessed selling from the opening tick to end on a negative note. Nifty closed at 17118 with a loss of 169 points.
On the daily chart, the index has formed a sizable bearish candle and closed below previous session low indicating further weakness. The index continues to move in a Higher Top and Higher Bottom formation on the hourly chart indicating positive bias. The chart pattern suggests that if Nifty crosses and sustains above 17200 level it would witness buying which would lead the index towards 17300-17400 levels. However if index breaks below 17050 level it would witness selling which would take the index towards 17000-16900. Nifty is trading above its 20 day SMA which indicates positive bias in the short term. Nifty continues to remain in a downtrend in the short to medium term, so selling on rallies continues to be our preferred strategy.
The daily strength indicator RSI has turned positive from the oversold territory and is above its reference line indicating positive bias.
The trend deciding level for the day is 17190. If NIFTY trades above this level then we may witness a further rally up to 17280-17445-17540 levels. However, if NIFTY trades below 17190 levels then we may see some profit booking initiating in the market, which may correct up to 17025-16930-16770 levels.
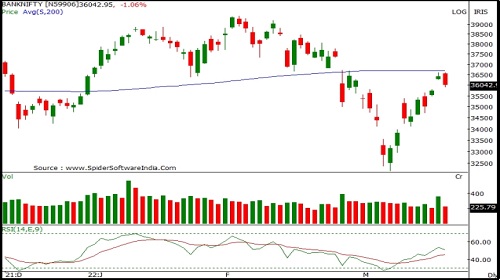
Banknifty
Banknifty opened with an upward gap but witnessed selling from the opening tick to close in negative terrain. Banknifty closed at 36019 with a loss of 410 points.
On the daily chart the index has formed a sizable bearish candle and violated previous session's low indicating further weakness. The index continues to move in a Higher Top and Higher Bottom formation on the hourly chart indicating positive bias. The chart pattern suggests that if Banknifty crosses and sustains above 36200 levels it would witness buying which would lead the index towards 36400-36600 levels. However if the index breaks below 35900 level it would witness selling which would take the index towards 35700-35500. Banknifty is trading below 50 and 100 day SMA indicating negative bias in the short to medium term. Banknifty continues to remain in a downtrend in the short to medium term, so selling on rallies continues to be our preferred strategy.
The daily strength indicator RSI has turned positive and is above its reference line indicating sustained strength
The trend deciding level for the day is 36175. If BANK NIFTY trades above this level then we may witness a further rally up to 36445-36875-37145 levels. However, if BANK NIFTY trades below 36175 levels then we may see some profit booking initiating in the market, which may correct up to 35745-35475-35045 levels.
To Read Complete Report & Disclaimer Click Here
For More Axis Securities Disclaimer https://simplehai.axisdirect.in/disclaimer-home
SEBI Registration number is INZ000161633
Views express by all participants are for information & academic purpose only. Kindly read disclaimer before referring below views. Click Here For Disclaimer