If NIFTY trades above this level then we may witness a further rally up to 15895-15935-15995 levels - Axis Securities

Follow us Now on Telegram ! Get daily 10 - 12 important updates on Business, Finance and Investment. Join our Telegram Channel
https://t.me/InvestmentGuruIndiacom
Download Telegram App before Joining the Channel
Nifty
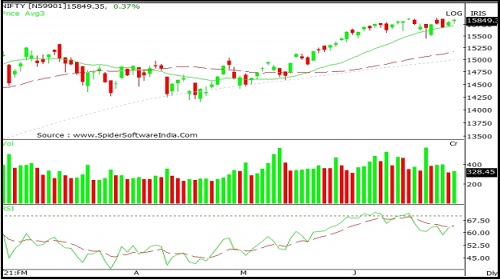
Nifty started the week on a negative note however buying momentum throughout the week recovered most of the earlier losses. Nifty closed at 15860 with a gain of 177 points on a weekly basis.
On the weekly chart index has formed a bullish candle and remained restricted within previous week's High-Low range indicating lack of strength on either side. The index is moving in a Higher Top and Higher Bottom formation on the weekly chart indicating positive bias. The chart pattern suggests that if Nifty crosses and sustains above 15900 level it would witness buying which would lead the index towards 16100-16300 levels. However if index breaks below 15700 level it would witness selling which would take the index towards 15600-15500. Nifty is trading above 20 and 50 day SMA's which are important short term moving averages, indicating positive bias in the short term. Nifty is expected to remain in an uptrend to sideways zone until it breaks 10600 on the downside. For the week, we expect Nifty to trade in the range of 16300-15800 with a positive bias.
The weekly strength indicator RSI and momentum oscillator Stochastic have both turned positive and are above their respective reference lines indicating positive bias
The trend deciding level for the day is 15835. If NIFTY trades above this level then we may witness a further rally up to 15895-15935-15995 levels. However, if NIFTY trades below 15835 levels then we may see some profit booking initiating in the market, which may correct up to 15800-15735-15700 levels.
Bank Nifty
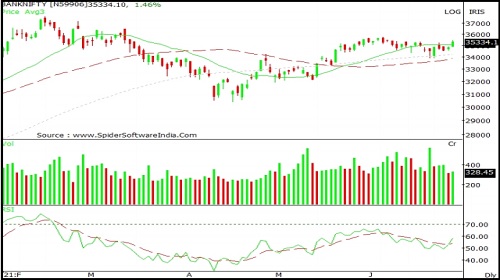
Bank Nifty started the week on a negative note however buying momentum throughout the week led the index to close on a strong note. Bank Nifty closed at 35365 with a gain of 807 points on a weekly basis.
On the weekly chart the index has formed a long bullish candle forming higher High-Low compared to previous week and has closed above previous week's high indicating positive bias. Since past 3-5 weeks, index has been consolidating within 35800-34000 levels indicating short term consolidation. Hence any either side breakouts will indicate further direction. The chart pattern suggests that if Bank Nifty crosses and sustains above 35500 levels it would witness buying which would lead the index towards 36000-37200 levels. However if index breaks below 34900 level it would witness selling which would take the index towards 34400-34000. Bank Nifty is trading above 20 , 50 and 100 day SMA's which is important short term moving average, indicating positive bias in the short term. Bank Nifty continues to remain in an uptrend in the medium term, so buying on dips continues to be our preferred strategy. For the week, we expect Bank Nifty to trade in the range of 37000-34500 with a positive bias.
The weekly strength indicator RSI and momentum oscillator Stochastic have both turned positive and are above their respective reference lines indicating positive bias.
The trend deciding level for the day is 35255 If BANKNIFTY trades above this level then we may witness a further rally up to 35600-35835-36175 levels. However, if BANKNIFTY trades below 35255 levels then we may see some profit booking initiating in the market, it may correct up to 35025-34680- 34445 levels
To Read Complete Report & Disclaimer Click Here
For More Axis Securities Disclaimer https://simplehai.axisdirect.in/disclaimer-home
SEBI Registration number is INZ000161633
Views express by all participants are for information & academic purpose only. Kindly read disclaimer before referring below views. Click Here For Disclaimer


More News
Weekly Market Outlook by Vinod Nair, Geojit Financial Services