If NIFTY trades above this level then we may witness a further rally up to 15840-15880-15925 levels - Axis Securities

Follow us Now on Telegram ! Get daily 10 - 12 important updates on Business, Finance and Investment. Join our Telegram Channel
Nifty
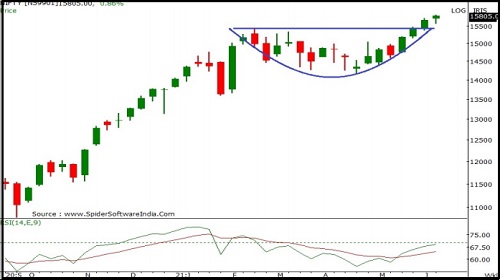
Nifty started the week on a positive note and remained consolidated for most part of the week however Friday's gains pulled the index higher to end in green. Nifty closed at 15799 with a gain of 129 points on a weekly basis.
On the weekly chart the index has formed a small Bullish candle carrying a long lower shadow indicating buying support at lower levels. The index is moving in a Higher Top and Higher Bottom formation on the weekly chart indicating positive bias. The chart pattern suggests that if Nifty crosses and sustains above 15850 level it would witness buying which would lead the index towards 15950-16100 levels. However if index breaks below 15600 level it would witness selling which would take the index towards 15450-15350. Nifty is trading above 20 and 50 day SMA's which are important short term moving averages, indicating positive bias in the short term. Nifty continues to remain in an uptrend in the medium term, so buying on dips continues to be our preferred strategy. For the week, we expect Nifty to trade in the range of 16100- 15600 with a positive bias.
The weekly strength indicator RSI and momentum oscillator Stochastic have both turned positive and are above their respective reference lines indicating positive bias.
The trend deciding level for the day is 15795. If NIFTY trades above this level then we may witness a further rally up to 15840-15880-15925 levels. However, if NIFTY trades below 15795 levels then we may see some profit booking initiating in the market, which may correct up to 15755-15710-15670 levels.
Bank Nifty
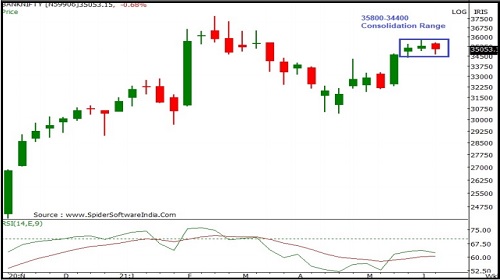
Bank Nifty started the week on a flat note and remained in a narrow range (35800-35000) throughout the week, indicating lack of strength on either side. Bank Nifty closed at 35047 with a loss of 244 points on a weekly basis.
On the weekly chart the index has formed a small Bearish candle with shadows on either side indicating indecisiveness amongst participants regarding the direction. Since the past three weeks, index is consolidating within 35800-34400 levels indicating short term consolidation. Hence any either side breakouts will indicate further direction. The chart pattern suggests that if Bank Nifty crosses and sustains above 35500 level it would witness buying which would lead the index towards 36000-36500 levels. However if the index breaks below 34600 level it would witness selling which would take the index towards 34000-33700. Bank Nifty is trading above 20 , 50 and 100 day SMA's which is an important short term moving average, indicating positive bias in the short term. Bank Nifty continues to remain in an uptrend in the medium term, so buying on dips continues to be our preferred strategy. For the week, we expect Bank Nifty to trade in the range of 36500-34500 with mixed bias.
The weekly strength indicator RSI and momentum oscillator Stochastic have both turned positive and are above their respective reference lines indicating positive bias
The trend deciding level for the day is 35095 If BANKNIFTY trades above this level then we may witness a further rally up to 35295-35545-35750 levels. However, if BANKNIFTY trades below 35095 levels then we may see some profit booking initiating in the market, it may correct up to 34845-34640- 34390 levels
To Read Complete Report & Disclaimer Click Here
For More Axis Securities Disclaimer https://simplehai.axisdirect.in/disclaimer-home
SEBI Registration number is INZ000161633
Views express by all participants are for information & academic purpose only. Kindly read disclaimer before referring below views. Click Here For Disclaimer


More News

Equity benchmarks pared some of Tuesday`s gains amid mixed global cues and settled Wednesday...