Covid-II ; Opportunity cost sub- optimal vaccine strategy By Emkay Global Financial Services
A successful vaccine strategy is the cheapest optimal policy path to economic normalization.
The welfare cost of universal jabbing at 0.6-0.7% of GDP much lower than 0.9-1.0% loss of monthly economic output amid current restrictions
Monthly loss of GVA growth by ~90bps as per current restrictions v/s 50bps seen in Mid-April. FY22 growth downgraded to 9.9% from 11%
Base case- by Mar’22 and Jul’22, 70% and 100% of the universal population will likely be vaccinated
Emkay’s measure of optimal vaccine distribution state-wide suggests like UP, DL and TN have a much lower current share than required, whereas RJ, GJ and MH are receiving more.
General govt. fiscal cost of vaccination ~0.3% of GDP; State-wise UP and MP to pay the most.
MH and GJ seem to have more fiscal space to respond to new health cost and other welfare measures post Covid-II.
Policy response should expand beyond health to target income support and labor dislocations
Mumbai, As per a research report by Emkay Global Financial Services, stepping up the vaccination drive remains the most viable and cheapest policy path to economic normalization given the strong positive externalities. The calculations suggest that the overall; welfare cost of vaccinating universal population would be 0.6-0.7% of GDP, assuming no wastage and optimal distribution. This is much lower than the 0.9-1.0% loss of monthly output amid soft lockdowns. Their FY22 GDP forecast is marked lower to 9.9% from 11%
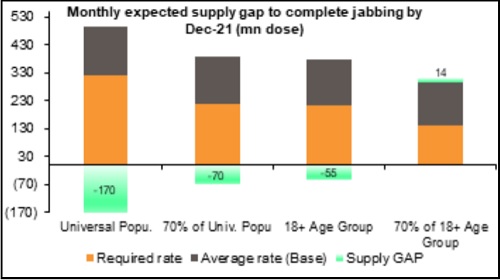
Average monthly supply gap of ~170mn jabs to cover universal population by CY21-end
The vaccination drive is skewed state-wise and has overall slowed substantially, with current 7dma rate of ~1.9mn shots, <50% below the peak ~3.7mn in March 21. The supply gap is significant and can only be resolved by production ramp-up. Even after assuming enhanced supply from July 21 and November 21, there will still be a supply gap of ~170mn jabs per month on an average for covering universal population by Dec-21. Emkay Global’s base case suggests that by March 2022 and July 2022, 70% and 100% of the universal population will likely be vaccinated. The bull and bear case scenarios suggest a 5-11M early/delay in the trajectory, respectively.
Monthly output loss due to Covid-II widens to Rs1.25tn vs. Rs750bn seen in Mid-April
Amid states’ evolving mobility guidelines and increasing geographical spread of virus, our bottom-up projections now suggest that for every month of current localized lockdowns, the output loss would now be ~Rs1.25tn vs. Rs750bn as per the restrictions seen in mid-April 21. This implies a monthly loss of GVA growth by ~90bps and compares with: (1) Emkay Global’s mid-April 2021 estimated loss of 50bps and (2) estimated loss of more than 5%pts in output growth per month during Covid-I lockdown.
Admitting that the situation is still in a flux, but as per current dynamics, Emkay Global expect Q1FY22 annualized growth to be ~16.5% vs. 22%+ estimated before the second wave.
Is there an optimal vaccination strategy to minimize socio-economic cost?
It is debatable whether decentralization, privatization or tiered-pricing of the vaccine is indeed the fastest or the best strategy to cover wider population, given state-wide socio-economic and bargaining disparities amid current vaccine production monopoly.
Emkay Global tried estimating the optimal state share by creating a weighted distribution measure based on parameters such as population and its density, urban-rural ratio, current R-factor, and active cases and death load. The measure suggests that states like UP, Delhi and TN have a much lower current share than they need, whereas Rajasthan, Gujarat and Maharashtra are receiving relatively more
General govt. fiscal cost of vaccination ~0.3% of GDP; State-wise UP and MP to pay the most
We estimate the total cost of vaccination drive in a no wastage scenario is ~0.6-0.7% of GDP, of which states would bear 0.25% of GDP and private sector ~0.4% of GDP and Centre bears the least cost. For states, the fiscal burden of vaccination would vary as per their population and its distribution skewness toward the sub-45 age group. Our cross-state assessment of vaccination cost shows that UP and MH are likely to bear the maximum absolute cost, while seen from the lens of each state’s gross output, states like UP, MP and Chhattisgarh lead the pack. We note that the average health spending by states is still less than 1% of SGDP (FY22BE ~0.8% of SGDP -- ~5.4% total states’ expenditure). The vaccination cost bump-up can however be borne easily as consolidated state GFD/GDP stands at ~3.3% of GDP (vs. the deficit cap is 4% of GDP) —giving them breather to loosen their purse strings
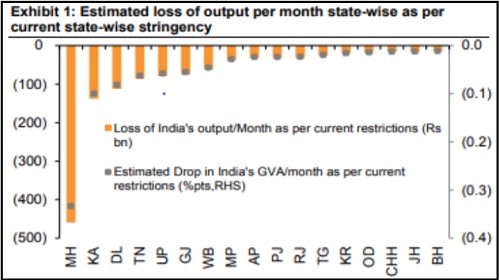
Exhibit 1: State-wise UP needs to be allotted more than the current share for optimal vaccine strategy
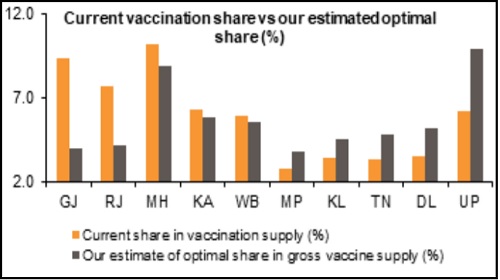
Exhibit 2: Supply gap for vaccinating 70% of universal population by Dec’21 is ~70 mn doses/month (cumulative ~500 mn doses)
To Read Complete Report & Disclaimer Click Here
Above views are of the author and not of the website kindly read disclaimer


