Copper, Natural Gas, Silver and Zinc Commodity Report Of 30 /04/2021 - Enrich Commodities

Follow us Now on Telegram ! Get daily 10 - 12 important updates on Business, Finance and Investment. Join our Telegram Channel
https://t.me/InvestmentGuruIndiacom
Download Telegram App before Joining the Channel
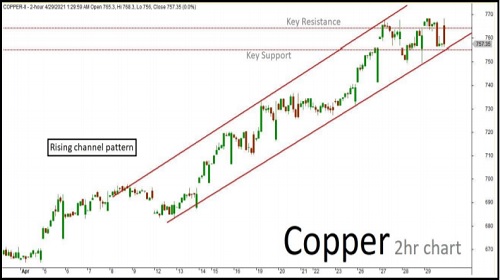
COPPER
Technical outlook
Copper May future 2hr chart has formed "Rising channel" pattern. The last few sessions ended up sideways mode testing near new historical high. The market is still expected to continue on bearish momentum based on the current price action, once the same break below the current key support holding near 755. The downside rally could be testing all the way up to 752-749 levels in the upcoming sessions. Alternatively, if the market struggles to break the support level, then it might revise the trend to bullish/sideways mode. Key resistance holds at 764.
Technical Chart
To Read Complete Report & Disclaimer Click Here
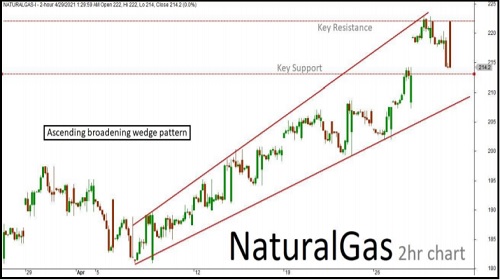
NATURAL GAS
Technical outlook
Natural gas 2hr chart has formed “Ascending broadening wedge” pattern. The last few sessions ended up sideways mode along with some corrections inside the channel. The market is expected to continue on the bearish momentum based on the price action, once break below a key support holding near 213. The downside rally could be testing all the way through 210-207 levels in the upcoming sessions. Alternatively, if the market struggles to break the support level, then it might retest the same and turn bullish/sideways once again. Key resistance holds at 222.
Technical Chart
To Read Complete Report & Disclaimer Click Here
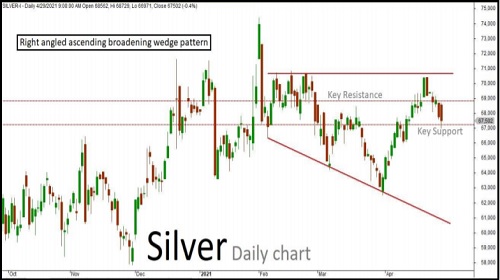
SILVER
Technical outlook
MCX Silver May futures technical chart has taken the formation of "Right angled descending broadening wedge" pattern in daily time frame. Last few sessions ended up in bearish mode along with some corrections inside the channel. The market is expected to continue on bearish momentum based on the current price action, once the same break below the key support level holding near 67200. The downside rally could be extending all the way up to 66400-65600 levels in the upcoming sessions. An alternative scenario indicates that if the market struggles to break the support level, then it might retest the same and revise the trend to bullish/sideways mode once again. Key resistance holds near 68800. A slide to 69600 is also a possibility if the price makes or break above the current resistance level.
Technical Chart
To Read Complete Report & Disclaimer Click Here
ZINC
Technical outlook
Zinc April future 4hr Chart has formed "Rising channel" pattern. The last few sessions ended up sideways mode near new historical high. The market is expected to continue on the bearish term based on the current price action, once the same breaks below the current key support holding near 231. The downside rally could be testing all the way up to 229.50-228 levels in the upcoming sessions. Alternatively, if the market struggles to break the support level, then it might retest the same and revise the trend to bullish/sideways. Key resistance holds at 235.50
Technical Chart

To Read Complete Report & Disclaimer Click Here
Please refer disclaimer at https://enrichbroking.in/disclaimer
SEBI Registration number is INZ000078632
Views express by all participants are for information & academic purpose only. Kindly read disclaimer before referring below views. Click Here For Disclaimer