Banknifty opened with an upward gap but witnessed selling from the opening tick - Axis Securities

Nifty
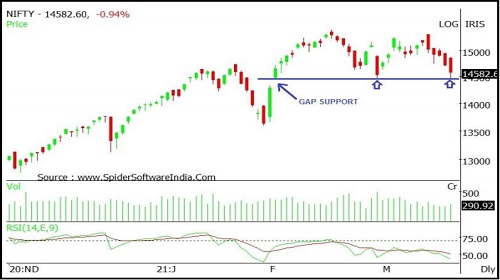
Nifty opened with an upward gap but witnessed selling from the opening tick to end on a negative note. Nifty closed at 14558 with a loss of 163 points.
On the daily chart the index has formed a Bearish candle with long lower shadow indicating buying support at lower levels. It has taken support from the previous “gap support” which is an encouraging sign. The index continues to move in a Lower Top and Lower Bottom formation on the hourly chart indicating negative bias. The chart pattern suggests that if Nifty breaks and sustains below 14470 level it would witness selling which would lead the index towards 14300-14200 levels. Important Resistances for the day are placed at 14850-15000. Nifty is trading below 20 day SMA indicating negative bias in the short to medium term. Nifty continues to remain in an uptrend in the medium and long term, so buying on dips continues to be our preferred strategy.
The daily strength indicator RSI is moving downwards and is quoting below its reference line indicating negative bias.
The trend deciding level for the day is 14635. If NIFTY trades above this level then we may witness a further rally up to 14795-15035-15190 levels. However, if NIFTY trades below 14635 levels then we may see some profit booking initiating in the market, which may correct up to 14400-14240-14005 levels
Banknifty
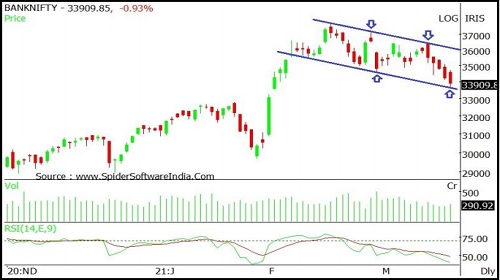
Banknifty opened with an upward gap but witnessed selling from the opening tick to end on a negative note. Banknifty closed at 33857 with a loss of 372 points.
On the daily chart the index has formed a Bearish candle with a lower shadow indicating buying at lower levels. The index continues to move in a Lower Top and Lower Bottom formation on the hourly chart indicating negative bias. It has halted at the lower end of the declining price channel indicating signs of short term bounce back into the index. The chart pattern suggests that if Banknifty crosses and sustains above 34000 level it would witness buying which would lead the index towards 34400-35000 levels. However if index breaks below 33500 level it would witness selling which would take the index towards 33300-33000. Banknifty is trading below 20 day SMA indicating negative bias in the short to medium term. Banknifty continues to remain in an uptrend in the medium and long term, so buying on dips continues to be our preferred strategy.
The daily strength indicator RSI is moving downwards and is quoting below its reference line indicating negative bias.
The trend deciding level for the day is 34070. If BANK NIFTY trades above this level then we may witness a further rally up to 34545-35235-35710 levels. However, if BANK NIFTY trades below 34070 levels then we may see some profit booking initiating in the market, which may correct up to 33385-32910-32220 levels
To Read Complete Report & Disclaimer Click Here
For More Axis Securities Disclaimer https://simplehai.axisdirect.in/disclaimer-home
SEBI Registration number is INZ000161633
Views express by all participants are for information & academic purpose only. Kindly read disclaimer before referring below views. Click Here For Disclaimer