Bank Nifty started the week with an upward gap and buying momentum for most part of the week led it to close in positive territory - Axis Securities

Follow us Now on Telegram ! Get daily 10 - 12 important updates on Business, Finance and Investment. Join our Telegram Channel
https://t.me/InvestmentGuruIndiacom
Download Telegram App before Joining the Channel
Nifty
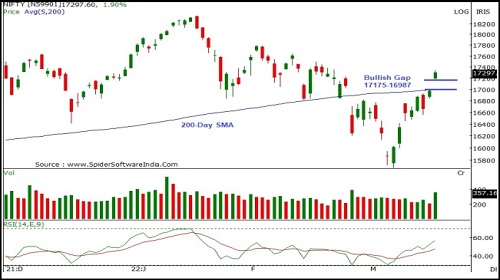
Nifty started the week on a flat note and buying momentum throughout the week led it to close on a strong note. Nifty closed at 17287 with a gain of 657 points on a weekly basis.
On the weekly chart the index has formed a long bullish candle forming higher High-low compared to previous week and has closed above previous week's high indicating positive bias. The index is moving in a Lower Top and Lower Bottom formation on the weekly chart indicating negative bias. The chart pattern suggests that if Nifty crosses and sustains above 17400 levels it would witness buying which would lead the index towards 17600-17800 levels. However if the index breaks below 17100 level it would witness selling which would take the index towards 17000- 16800. Nifty is trading above the 20 and 200 day SMA which are important short term moving averages, indicating positive bias in the short term. Nifty continues to remain in a downtrend in the short to medium term, so selling on rallies continues to be our preferred strategy. For the week, we expect Nifty to trade in the range of 17600-17000 with a positive bias.
The daily and weekly strength indicator RSI is moving upwards and is quoting above its reference line indicating positive bias.
The trend deciding level for the day is 17270. If NIFTY trades above this level then we may witness a further rally up to 17365-17440-17530 levels. However, if NIFTY trades below 17270 levels then we may see some profit booking initiating in the market, which may correct up to 17195-17100-17025 levels.
Bank Nifty
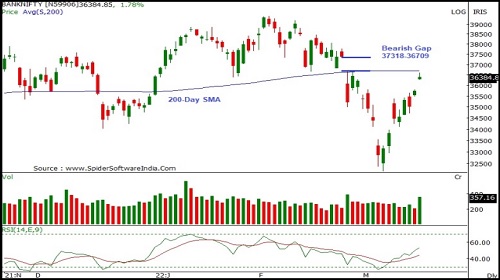
Bank Nifty started the week with an upward gap and buying momentum for most part of the week led it to close in positive territory. Bank Nifty closed at 36429 with a gain of 1882 points on a weekly basis.
On the weekly chart the index has formed a sizable bullish candle forming higher High-low compared to previous session indicating positive bias. The index is moving in a Lower Top and Lower Bottom formation on the weekly chart indicating negative bias. The chart pattern suggests that if Bank Nifty crosses and sustains above 36700 levels it would witness buying which would lead the index towards 37000-37500 levels. However if the index breaks below 36200 level it would witness selling which would take the index towards 35800-35500. Bank Nifty is trading below 50, 100 and 200 day SMA which are important short term moving averages, indicating negative bias in the short to medium term. Bank Nifty continues to remain in a downtrend in the short to medium term, so selling on rallies continues to be our preferred strategy. For the week, we expect Bank Nifty to trade in the range of 37300-35500 with mixed bias.
The daily and weekly strength indicator RSI is in bullish mode and sustaining above 50 mark which supports bullish sentiments ahead.
The trend deciding level for the day is 36435 If BANKNIFTY trades above this level then we may witness a further rally up to 36605-36785-36955 levels. However, if BANKNIFTY trades below 36435 levels then we may see some profit booking initiating in the market, it may correct up to 36255-36085-35905 levels.
To Read Complete Report & Disclaimer Click Here
For More Axis Securities Disclaimer https://simplehai.axisdirect.in/disclaimer-home
SEBI Registration number is INZ000161633
Views express by all participants are for information & academic purpose only. Kindly read disclaimer before referring below views. Click Here For Disclaimer


More News

India VIX index is at 10.69 v/s 10.98 ATM CE IV 9.94 & PE IV 10.03 - Axis Securities Ltd