As indicated by the SGX Nifty, our markets opened with a gap down on Friday - Angel One Ltd

Sensex (61223) / Nifty (18256)
As indicated by the SGX Nifty, our markets opened with a gap down on Friday, however this dip got bought into as the benchmark Index recovered all its lost ground. Nifty eventually ended flat but at the highest point of the day tad above 18250
During the last week, the bulls pocketed more than 2% and with this, the Nifty has rallied over 1800 points in a span of four weeks, which is certainly remarkable. The market is now showing a typical behavior which generally happens after a decent rally and if any major event is close by. Since we are inching closer to the mega event Budget, key indices seem to have slipped into a consolidation mode. For this week, the next level to watch out for remains at 18350 and once its surpassed, there is no major level visible before 18600.
As of now, we do not expect a runaway move in this week and hence, traders are advised to keep focusing on individual stocks. Because almost each and every sector has started chipping in turn by turn. Apart from this, the broader market has started buzzing which generally indicates a healthy nature of any rally. One needs to keep concentrating on such potential movers in order to fetch decent gains. Now as far as supports are concerned, 18200 followed by 18100 should be considered as key levels and the sacrosanct base remains at 18000.
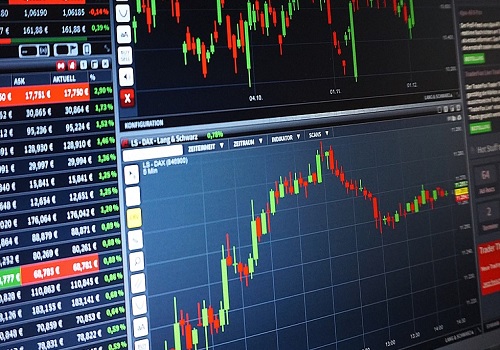
Nifty Daily Chart

Nifty Bank Outlook - (38728)
The banking index has seen a continuation in the uptrend as it settled the week on a positive note with gains of nearly 1.67% at 38370. However, the index has lost some traction in the latter half of the week and showcased a range-bound movement. At present, the index is hovering between 50 and 61.80 percent of the Fibonacci retracement of the recent fall from it's all-time high level that is placed at 37924 and 38845 respectively
On the technical parameters, the index is hovering well above the mean of the Bollinger band on the weekly time frame, indicating its inherent strength. Even the 21 DEMA has seen a positive crossover to 50 and 100 DEMA in recent period affirming the bullish stance in the counter. It is just the 14 days RSI that has signaled a sign of cautiousness at the current zone. And as per the retracement levels, the index is expected to remain within the range until a decisive breach occurs. As we advance, any dip towards 37900-38000 should be utilized by the bulls, while on the flip side, a sturdy wall is placed near 38900- 39000 zone
Nifty Bank Daily Chart

To Read Complete Report & Disclaimer Click Here
Please refer disclaimer at https://www.angelone.in/
SEBI Regn. No.: INZ000161534
Views express by all participants are for information & academic purpose only. Kindly read disclaimer before referring below views. Click Here For Disclaimer