

If NIFTY trades above this level then we may witness a further rally up to 15255-15310-15365 levels - Axis Securities

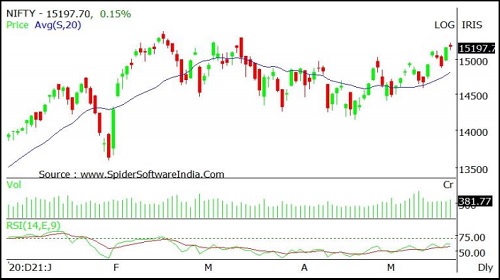
Nifty
Nifty opened with an upward gap and remained lackluster within narrow trading range throughout the day. Nifty closed at 15198 with a gain of 22 points.
On the daily chart the index has formed a small bullish candle with shadows on either side representing extreme volatality as well as indecisiveness amongst participants regarding the direction. The index is moving in a Higher Top and Higher Bottom formation on the daily chart indicating sustained up trend. The chart pattern suggests that if Nifty crosses and sustains above 15300 level it would witness buying which would lead the index towards 15400-15500 levels. However if index breaks below 15100 level it would witness selling which would take the index towards 15000-14900. Nifty is trading above its 20 day SMA which indicates positive bias in the short term. Nifty continues to remain in an uptrend in the medium and long term, so buying on dips continues to be our preferred strategy.
The daily strength indicator RSI has turned positive from the oversold territory and is above its reference line indicating sustained uptrend.
The trend deciding level for the day is 15200. If NIFTY trades above this level then we may witness a further rally up to 15255-15310-15365 levels. However, if NIFTY trades below 15200 levels then we may see some profit booking initiating in the market, which may correct up to 15145-15090-15035 levels
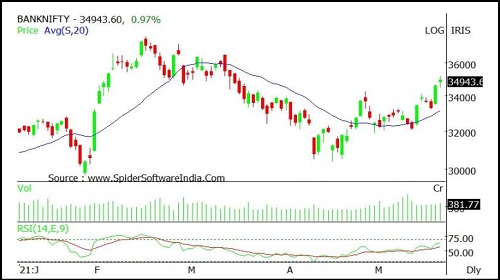
Banknifty
Banknifty opened with an upward gap and remained lackluster within narrow trading range throughout the day. Banknifty closed at 34944 with a gain of 337 points.
On the daily chart the index has formed a small bullish candle with shadows on either side representing extreme volatality as well as indecisiveness amongst participants regarding the direction. The index continues to move in a Higher Top and Higher Bottom formation on the hourly chart indicating positive bias. The chart pattern suggests that if Banknifty crosses and sustains above 35200 level it would witness buying which would lead the index towards 35500-35800 levels. Important Supports for the day is around 34500 However if index sustains belwo 34500 then it may witness profit booking which would take the index towards 34200-33900 levels.. Banknifty is trading above its 20 day SMA which indicates positive bias in the short term. Banknifty continues to remain in an uptrend in the medium and long term, so buying on dips continues to be our preferred strategy.
The daily strength indicator RSI has turned positive from the oversold territory and is above its reference line indicating sustained uptrend.
The trend deciding level for the day is 34895. If BANK NIFTY trades above this level then we may witness a further rally up to 35265-35585-35950 levels. However, if BANK NIFTY trades below 34895 levels then we may see some profit booking initiating in the market, which may correct up to 34575-34210-33890 levels
To Read Complete Report & Disclaimer Click Here
For More Axis Securities Disclaimer https://simplehai.axisdirect.in/disclaimer-home
SEBI Registration number is INZ000161633
Views express by all participants are for information & academic purpose only. Kindly read disclaimer before referring below views. Click Here For Disclaimer


.jpg)
