TRADING CALLS
- Achiievers Equites Ltd
- Aiwin Commodity Borker Pvt Ltd
- Angel One
- Arihant Capital Markets Ltd
- Axis Securities
- Chirag Singhvi
- Choice International Ltd
- Elite Wealth Advisors Ltd
- Emkay Global Financial Services Ltd
- Geojit Financial Services Ltd.
- GEPL Capital
- Green India Commodities
- HDFC Securities
- Hem Securities Ltd
- ICICI Direct
- ICICI Securities
- InvestmentGuruIndia.com
- Jainam Share Consultants Pvt Ltd
- Karvy Currency Derivatives
- Kedia Commodities
- Maitra Commodities Pvt. Ltd.
- Mansukh Securities & Finance Ltd
- Monarch Networth Capital Limited
- Motilal Oswal Financial Services Ltd
- Nirmal Bang Securities Pvt Ltd
- Reliance Securities
- Religare Broking Limited
- Sky commodities Pvt Ltd
- SPA Securities Ltd
- Sushil finance
- Swastika Investmart Ltd
- Tradebulls Securities (P) Ltd
- Ventura Securities Ltd
GEPL Capital

Published on 04-02-2026 03:13 pm
BOOK PROFITS OF 32.7% IN NIFTY 25600 PE 10 FEB 2026 @74 SHORT OF 110
Please refer disclaimer at https://web.geplcapital.com/term-disclaimerSEBI Registration number is INH000000081
Mansukh Securities & Finance Ltd

Published on 04-02-2026 12:47 pm
BUY MIDCAP NIFTY FUT ABOVE 13745 SL BELOW 13670 TGT 13775-13815-13855. 24 FEB
Plz refer disclaimer at www.moneysukh.comSEBI Registration number is INZ000164537
ICICI Direct

Published on 04-02-2026 11:54 am
Intraday Rational:
* Trend- Rebounded from former resistance now turned as support as per change of polarity principal.
* Levels -Buy around 50% retracement of last two-day upmove(58154-61229)
Click Here :- https://tinyurl.com/25bwctw9
Please refer disclaimer at https://secure.icicidirect.com/Content/StaticData/Disclaimer.htmlSEBI Registration number INZ000183631
ICICI Direct
Published on 04-02-2026 11:53 am
Technical Outlook:
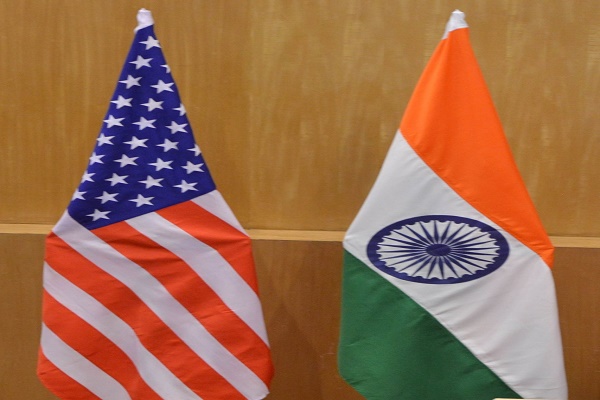
* Following the landmark India–US trade agreement, the index witnessed a powerful gap-up opening and recorded a new lifetime high, briefly crossing the 61,700 mark. However, latesession profit booking led to some cooling off from higher levels. On the daily chart, the price action resulted in a strong candle with a positive gap, indicating some breather after a sharp gap up.
* Technically, Bank Nifty has delivered a decisive breakout above its prior swing high of 60,400 and has retraced the preceding four-week corrective decline within just two trading sessions, highlighting an exceptionally strong pace of recovery. While sentiment remains overwhelmingly positive on the back of the trade deal, the index is expected to continue its upward trajectory within a well-defined broader structural framework.
* Hence, any corrective dips from current levels should be viewed as buying opportunities. A strong demand zone is placed around 58,500, which aligns with the 80% retracement of the recent upmove.
* Meanwhile, the Nifty PSU Bank Index formed a bearish candle with a positive gap while sustaining a higher-high–higher-low structure, indicating follow-through buying above Monday’s high. The index also managed to close above its 20-day EMA, reinforcing near-term strength. Going ahead, the index appears well positioned to challenge the 9,170 level in the coming weeks
Click Here :- https://tinyurl.com/25bwctw9
Please refer disclaimer at https://secure.icicidirect.com/Content/StaticData/Disclaimer.htmlSEBI Registration number INZ000183631
ICICI Direct
Published on 04-02-2026 11:53 am
Nifty Bank :60041
Technical Outlook
Day that was:
Bank Nifty surged to a fresh all-time high and closed the session firmly at 60,042, registering a robust gain of 2.4%. The broader banking pack echoed this strength, with both the Nifty PSU Bank and Nifty Private Bank indices advancing 2.5% each.
Click Here :- https://tinyurl.com/25bwctw9
Please refer disclaimer at https://secure.icicidirect.com/Content/StaticData/Disclaimer.htmlSEBI Registration number INZ000183631