Harmonic trade Opportunity in Chana - Kedia Commodity

Follow us Now on Telegram ! Get daily 10 - 12 important updates on Business, Finance and Investment. Join our Telegram Channel https://t.me/InvestmentGuruIndia
Download Telegram App before Joining the Channel
Chana
Unlike other common trading methods, Harmonic trading attempts to predict future movements. Market prices always exhibit trend, consolidation and re-trend behavior. They rarely reverse their trends and transitional phases to turn from a previous trend on a single bar. During this transitional phase, they experience trading ranges and price fluctuations. The primary theory behind harmonic patterns is based on price/time movements which adhere to Fibonacci ratio relationships and its symmetry in markets. Fibonacci ratio analysis works well with any market and on any timeframe chart. The basic idea of using these ratios is to identify key turning points, retracements and extensions along with a series of the swing high and the swing low points. The derived projections and retracemenits using these swing points will give key price levels for Targets or Stops.
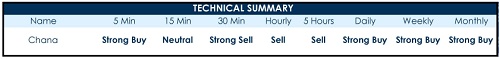
Technical Summary
Technical Chart
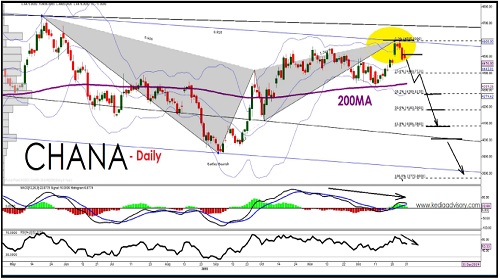
ACTION: SELL CHANA JAN BELOW 4490 SL ABV 4610 TGT 4340-4180. NCDX
To Read Complete Report & Disclaimer Click Here
Views express by all participants are for information & acadamic purpose only. Kindly read disclaimer before refering below views. Click Here For Disclaimer


.jpg)