

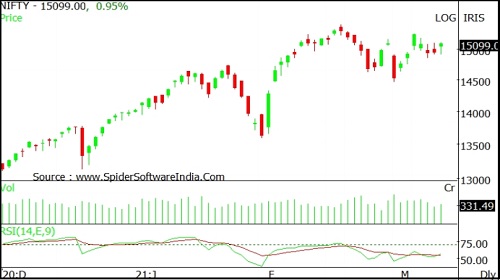
Nifty opened with an upward gap and witnessed selling for first part of the session - Axis Securities

Sensex
Nifty opened with an upward gap and witnessed selling for first part of the session. However last hour pullback action pulled index higher and recovered some of the earlier losses. Nifty closed at 15098 with a gain of 142 points.
On the daily chart the index has formed a Bullish candle with a lower shadow indicating buying at lower levels. The index continues to move in a Higher Top and Higher Bottom formation on the hourly chart indicating positive bias. The chart pattern suggests that if Nifty breaks and sustains below 14900 levels it would witness selling which would lead the index towards 14800-14700 levels. Important Resistances for the day are placed at 15300-15400. Nifty is trading above 20 and 50 day SMA's indicating positive bias in the short to medium term. Nifty continues to remain in an uptrend in the medium and long term, so buying on dips continues to be our preferred strategy.
The daily strength indicator RSI has turned positive from the oversold territory and is above its reference line indicating sustained uptrend.
The trend deciding level for the day is 15050. If NIFTY trades above this level then we may witness a further rally up to 15175-15250-15375 levels. However, if NIFTY trades below 15050 levels then we may see some profit booking initiating in the market, which may correct up to 14975-14850-14770 levels.
Nifty 50
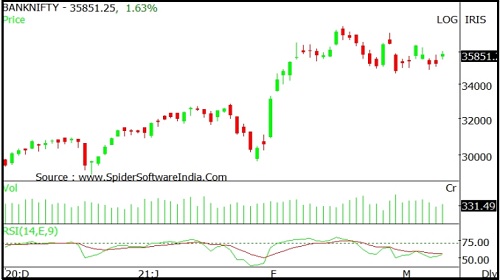
Banknifty opened with an upward gap and remained lacklustre within narrow trading range throughout the day. Banknifty closed at 35866 with a gain of 590 points.
On the daily chart the index has formed a small bullish candle with shadows on either side representing extreme volatility as well as indecisiveness amongst participants regarding the direction. The index continues to move in a Higher Top and Higher Bottom formation on the hourly chart indicating positive bias. The chart pattern suggests that if Banknifty crosses and sustains above 36000 level it would witness buying which would lead the index towards 36300-36600 levels. However if index breaks below 35500 level it would witness selling which would take the index towards 35200-34900. Banknifty is trading above 20 and 50 day SMA's indicating positive bias in the short to medium term. Banknifty continues to remain in an uptrend in the medium and long term, so buying on dips continues to be our preferred strategy.
The daily strength indicator RSI continue to remain flat and is below its reference line indicating absence of momentum on either side
The trend deciding level for the day is 35830. If BANK NIFTY trades above this level then we may witness a further rally up to 36115-36360-36645 levels. However, if BANK NIFTY trades below 35830 levels then we may see some profit booking initiating in the market, which may correct up to 35580-35295-35050 levels
To Read Complete Report & Disclaimer Click Here
For More Axis Securities Disclaimer https://simplehai.axisdirect.in/disclaimer-home
SEBI Registration number is INZ000161633
Views express by all participants are for information & academic purpose only. Kindly read disclaimer before referring below views. Click Here For Disclaimer


Tag News
More News

Quote on Pre-market comment 18th November 2025 by Amruta Shinde, Technical & Derivative Anal...

.jpg)
