GBPINR April futures formed two consecutive doji candlestick pattern suggesting indecisiveness at higher level - HDFC Securities

USDINR
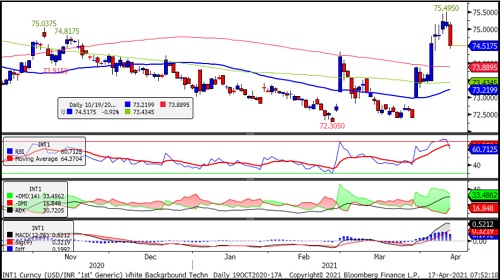
USDINR April futures formed bearish candle covering gains of last four days mainly on back of long unwinding, after parabolic up move in previous two weeks
The pair is having is having support at 73.89, the 200 days simple moving average and resistance at 75.50, recent high.
Momentum oscillator, Relative Strength Index(RSI) of 14 days period exited from overbought zone with negative cross over suggesting weakness. While MACD remains bullish by sustaining above zero line.
We expect USDINR April futures to consolidate in the range of 73.90 to 75.50 in coming days with broad view remains on bullish side following higher highs and lows on daily chart.
EURINR
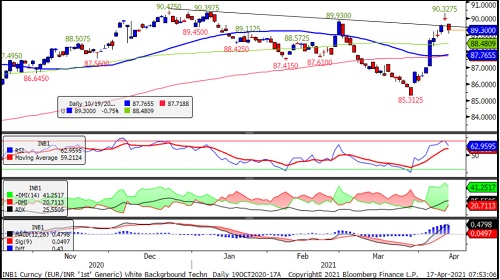
EURINR April futures formed “evening star” reversal pattern with confirmation below 89 while at the same time there is chance of forming “Inverse head and shoulder” pattern by forming low around 87.40. It will be difficult to say which way the pair will move
One should watch the neckline resistance of 90 odd level on closing basis for up trend while on downside there are high chance of 87.40 level.
Momentum oscillator, Relative Strength Index on daily chart exited from overbought zone while the MACD still remain bullish.
Looking at the overall structure, we remain neutral to Bullish in EURINR April future and wait for 87.40 or 90.35 to cross for fresh long position.
GBPINR
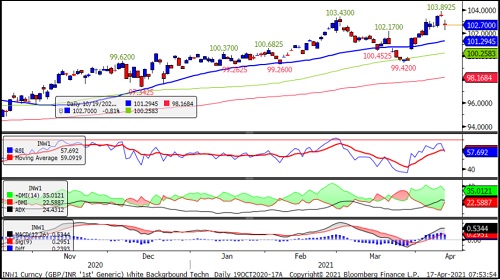
GBPINR April futures formed two consecutive doji candlestick pattern suggesting indecisiveness at higher level. That could be due to long unwinding near resistance.
The pair is having strong support at 100.25, the 100 days simple moving average which has been holding since last one year.
Momentum oscillator, Relative Strength Index (RSI) on daily chart formed a negative divergence and cross over suggesting near term profit booking and overall up trend.
We continue to hold Bullish view until it breaks the level of 100.25 while on higher side around 103.70 one should lighten long position. GBPINR April futures expected to trade in the range of 100 to 104.
JPYINR
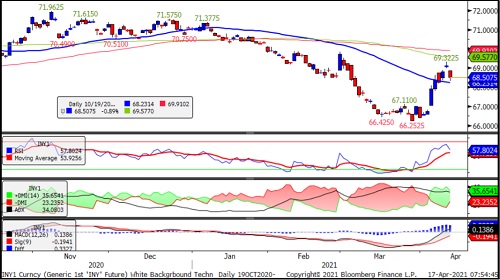
JPYINR April futures resisted around 100 days simple moving average i.e. 69.58 and has support at 68.20, the 50 days simple moving average.
The pair has formed evening star pattern with confirmation below 68.25.
Momentum oscillator, RSI on daily chart turned slightly weak but still remained above average suggesting positive momentum.
MACD also placed above zero line with bullish histogram indicating continuation of upward move
JPYINR April futures expected to resist around 69.91, the 200 days simple moving average while breaking of 68.25 level will open 67.10 on downside .
To Read Complete Report & Disclaimer Click Here
Please refer disclaimer at https://www.hdfcsec.com/article/disclaimer-1795
SEBI Registration number is INZ000171337
Views express by all participants are for information & academic purpose only. Kindly read disclaimer before referring below views. Click Here For Disclaimer