

No Record Found
Latest News
India`s cement demand to rise 6-7 pc in FY26 led by ...

1st phase of India`s Deep Ocean Mission on track for...

India poised to emerge as centre of gravity in new w...
India`s industrial production registers 1.2 per cent...

Adani Group, ISKCON serve devotion with nutrition du...
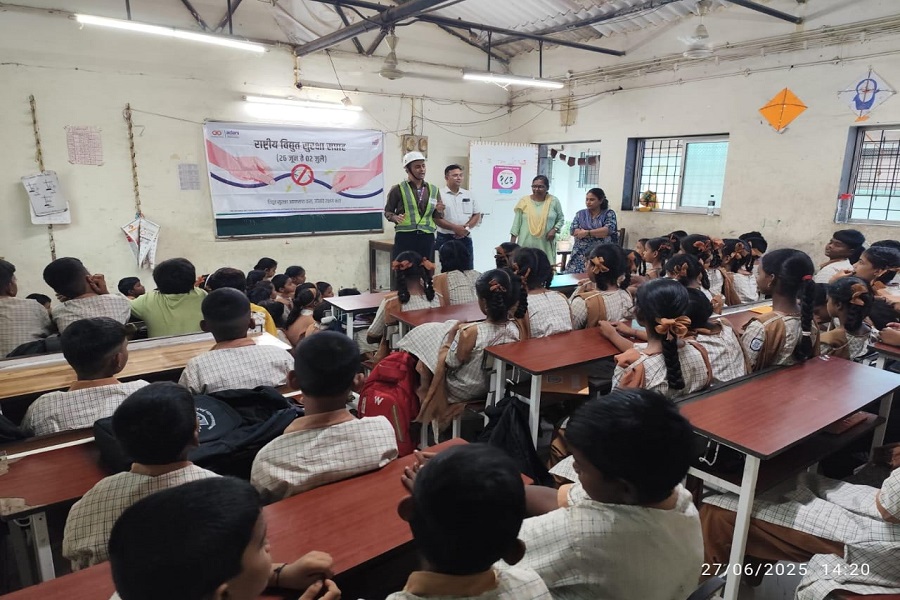
Adani Electricity observes National Electrical Safet...

IPO Note : HDB Financial Services Ltd by Choice Broking
Black Box eyes scalable growth with data centre and ...

IPO Note : Sambhv Steel Tubes Ltd by Choice Broking Ltd
`Backbone of rising India`: PM Narendra Modi highli...
Top News
News Not Found
Tag News
News Not Found
More News
News Not Found