

No Record Found
Latest News
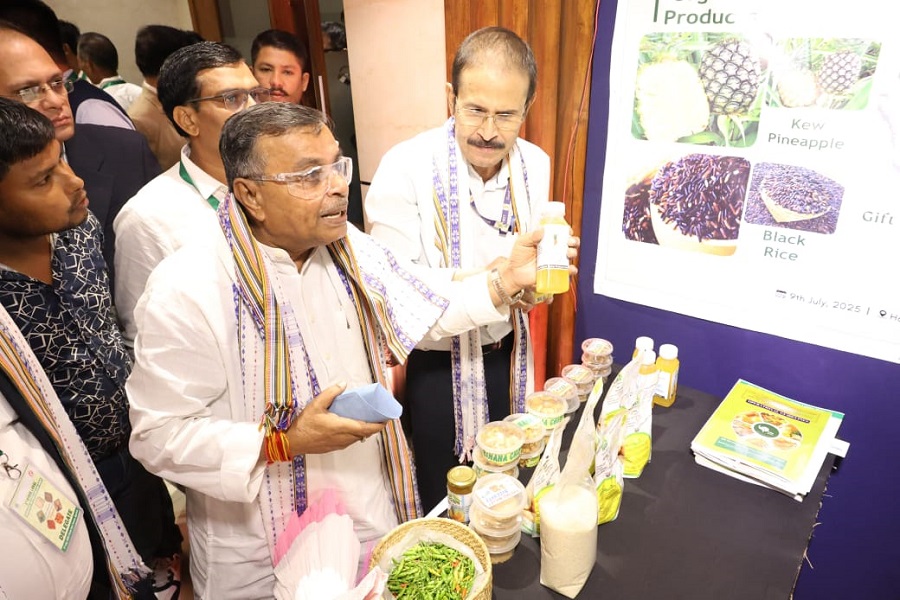
Tripura developed 25,000 ha organic land; 1,300 MT p...

MSTC launches e-marketplace with new corporate offic...
Adani Enterprises Ltd`s Rs 1,000 crore NCD issue ful...

Insurance Sector Update: A better quarter by Kotak I...

Q1FY26 Earnings Preview - FMCG & Retail by Axis Secu...
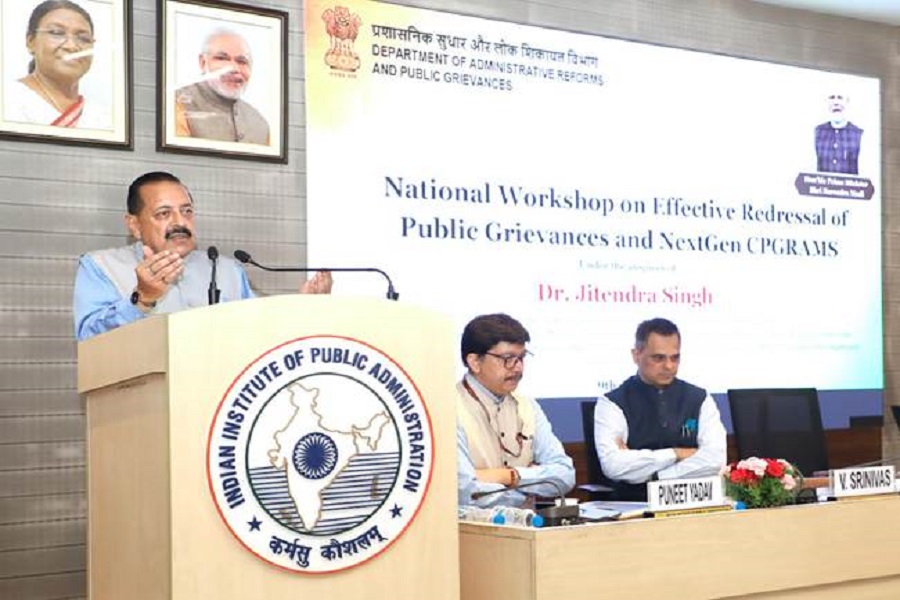
Over 1.15 crore public grievances redressed between ...

IPO Note : GLEN Industries Ltd by Choice Broking Ltd
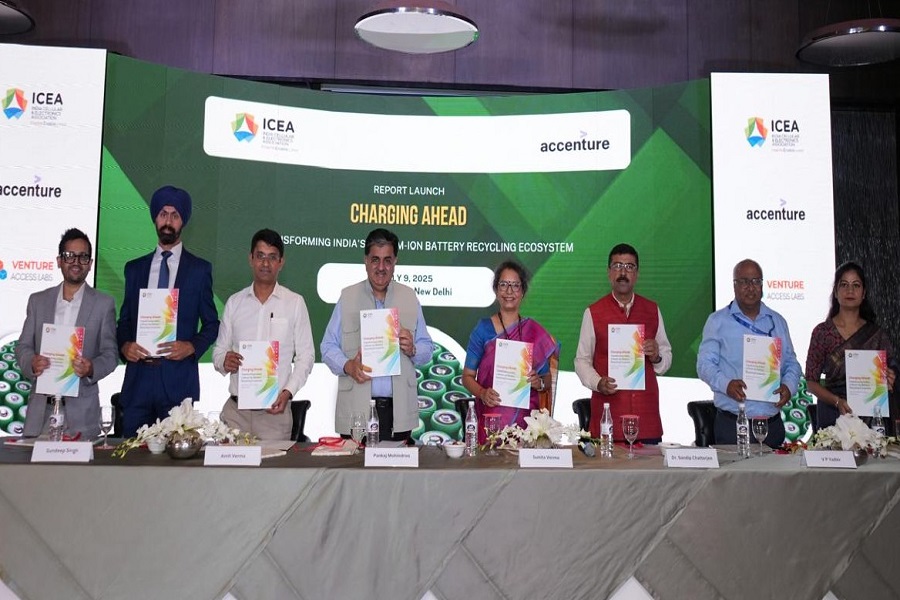
India offers domestic circular battery economy worth...

Chemicals Sector Update : Mixed results amid continu...

Real Estate Sector Update : Starting on a strong not...
Top News
News Not Found
Tag News
News Not Found
More News
News Not Found