Weekly Tech Picks - Larsen & Toubro Infotech Limited, Adani Enterprises Limited, Solara Active Pharma Sciences Limited, Piramal Enterprises Limited By Axis Securities

Larsen & Toubro Infotech Limited
* On the weekly chart, the stock has witnessed 6-8 months “Consolidation Range” breakout at 4500 levels.
* The stock is well placed above its 20 and 50-day SMA’s which reconfirm bullish sentiments
* Rising volumes at breakout zone signals increased participation on 06 August, 2021 *Holding period is 3 to 4 weeks. correction
* The stock is in strong up trend across all the time frames forming a series of higher tops and bottoms.
* The daily and weekly strength indicator RSI is in bullish mode which supports rising strength as well as momentum.
* The above analysis indicate an upside of 5000-5130 levels.
* Holding period is 3 to 4 weeks.

Buy Larsen & Toubro Infotech Limited Buy Range: 4700-4606, CMP: 4,765 Upside: 7%-10%, Stop loss: 4450
Adani Enterprises Limited
* On the daily chart, the stock has witnessed Multiple Resistance breakout around 1470 levels which signals strong comeback of bulls
* Huge volumes on the breakout , signals increased participation near breakout zone.
* The stock is strong uptrend as it is Adani Enterprises Limited Weekly Tech Picks 06 August, 2021 continue to form a series of higher Tops and higher Bottom formation on weekly and monthly chart
* The stock is also well placed above its 20, 50 and 100 Day SMA which reconfirm bullish trend
* The daily and weekly strength indicator RSI is placed above 50 mark which supports rising strength. The above analysis indicate an upside of 1600- 1650 levels.
* Holding period is 3 to 4 weeks.
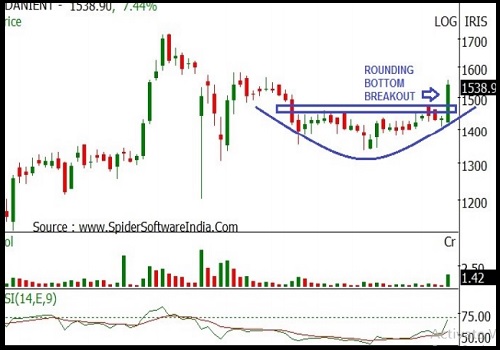
Buy Adani Enterprises Limited Buy Range: 1500-1470 CMP: 1,539 Upside: 8% -11% Stop loss: 1422
Solara Active Pharma Sciences Limited
* On the weekly chart, the stock has witnessed “Flag” formation breakout at 1750 levels on a closing basis along with rising volumes.
* On the daily and weekly chart, the stock continue to scale upward forming higher Top and higher Bottom formation indicating sustained uptrend
* The stock is well placed above its 20, 50 and 100 day SMA which reconfirms upside momentum
* The daily and weekly strength indicator RSI is in bullish mode along with positive crossover which supports rising strength
* The above analysis indicate an upside of 1900-1985 levels *Holding period is 3 to 4 weeks.
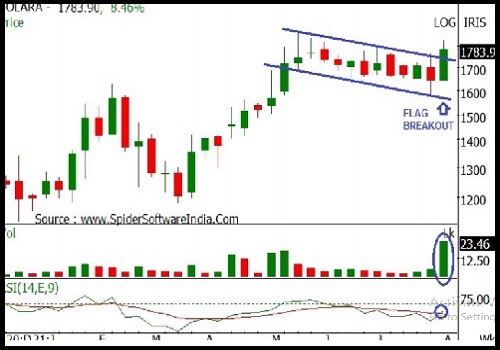
Buy Solara Active Pharma Sciences Limited Buy Range: 1783-1749 CMP: 1,784 Upside: 8% – 12% Stop loss: 1643
Piramal Enterprises Limited
* On the weekly chart, the stock has witnessed “Flag” formation breakout at 2400 levels on a closing basis along with rising volumes.
* On the weekly and monthly chart, the stock continue to form a series of higher Tops and higher Bottoms which signals strong up trend
* This buying was observed from its 20 day SMA (2308) support zone which remains a crucial level to watch for
* The daily and weekly Bollinger Band buy signal also reconfirmed rising momentum
* The daily and weekly strength indicator RSI is in bullish mode along with positive crossover which supports rising strength. The above analysis indicate an upside of 2775-2850 levels.
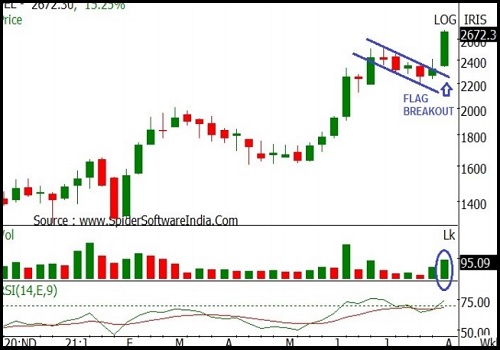
Buy Piramal Enterprises Limited Buy Range: 2600-2548 CMP: 2,669 Upside: 8% – 11% Stop loss: : 2445
To Read Complete Report & Disclaimer Click Here
For More Axis Securities Disclaimer https://simplehai.axisdirect.in/disclaimer-home
SEBI Registration number is INZ000161633
Above views are of the author and not of the website kindly read disclaimer


Tag News
More News

Stock Picks : GAIL India Ltd, State Bank of India Ltd and SBI Cards & Payment Services Ltd b...