Weekly Tech Picks - Ambuja Cements Ltd,Bajaj Finserv Ltd,Canara Bank Ltd,Tata Steel Ltd By Axis Securities

Follow us Now on Telegram ! Get daily 10 - 12 important updates on Business, Finance and Investment. Join our Telegram Channel
https://t.me/InvestmentGuruIndiacom
Download Telegram App before Joining the Channel
Ambuja Cements Ltd
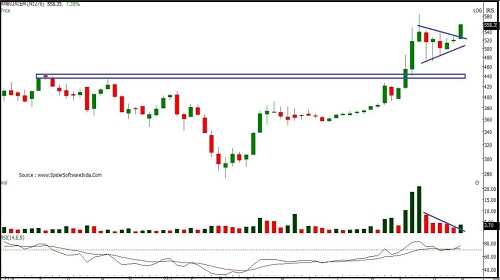
• On the weekly time frame Ambuja Cement has decisively broken out above “pennant” pattern. Pattern is formed after a sharp rally from 350 level.
• Break out after a “pennant” pattern signifies continuation of previous rally.
• This breakout is accompanied with rising volume, which normally dried up during “pennant” pattern formation
• The weekly strength indicator RSI is in The daily and weekly strength indicator RSI is in bullish mode and weekly RSI cross above 9EMA which generated a buy signal
• The above analysis indicates an upside of 600-620 levels.
*Holding period is 3 to 4 weeks.
Buy Ambuja Cements Ltd CMP: 558 Buy Range: 552-540 Stop loss: 519 Upside: 10% - 14%
Bajaj Finserv Ltd
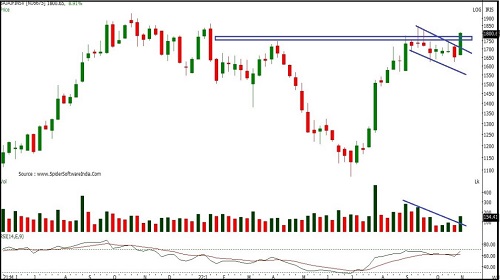
• On the weekly time frame the stock has decisively broken out above “Bullish flag” pattern.
• Stock has also close above multiple resistance zone place between 1780- 1740.
• This breakout is accompanied with rising volume, which normally dried up during “Flag” pattern formation.
• The stock is trading above 20, 50, 100 and 200 SMA indicating positive trend and bullish sentiment on a stock.
• The daily and weekly strength indicator RSI is in bullish mode and weekly RSI cross above 9EMA which generated a buy signal.
• The above analysis indicates upside of 1950-2000 levels.
*Holding period is 3 to 4 weeks.
Buy Bajaj Finserv Ltd CMP: 1800 Buy Range: 1770-1740 Stop loss: 1660 Upside: 11% –14%
Canara Bank Ltd.
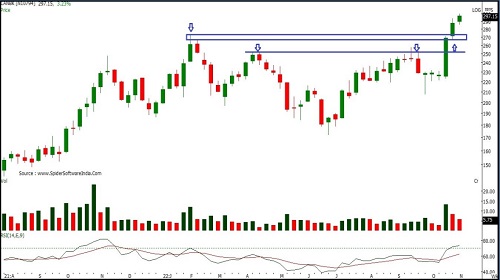
• On the weekly time frame the stock has decisively broken out above “multiple resistance” zone. Breakout area for the same was place at 273-267 level.
• On the daily time frame, the stock is in strong up trend forming a series of higher tops and bottoms
• The stock is well placed above its 20,50,100 and 200 Day SMA’s 4 November, 202220,50,100 and 200 Day SMA’s which reconfirm bullish sentiments
• The weekly strength indicator RSI is in positive terrain and sustaining above 9EMA as well as 50 mark indicating positive momentum.
• The above analysis indicates upside of 324-330 levels. *Holding period is 3 to 4 weeks.
Buy Canara Bank Ltd CMP: 297 Buy Range: 294-288 Stop loss: 275 Upside: 11%-13%
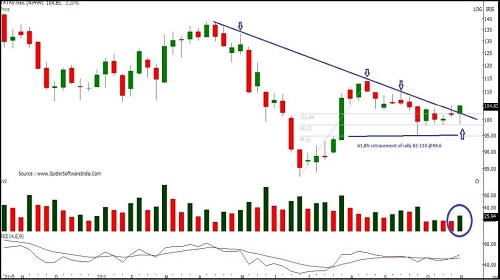
Tata Steel Ltd.
• On the weekly time frame the stock has decisively broken out above “Downward sloping trendline” which was place at 102 level.
• Stock took a support at 61.8% Fibonacci retracement of a rally from 82-114 place at 94.5 level which forms a short term bottom.
• The breakout is accompanied with increase in volume confirming participation at breakout level.
• The weekly strength indicator RSI is in cross above 9EMA mark indicating positive momentum.
• The above analysis indicates upside of 112 -15 levels. *Holding period is 3 to 4 weeks.
Buy Tata Steel Ltd CMP:105 Buy Range: 102-100 Stop loss: 96 Upside: 11%-14%
To Read Complete Report & Disclaimer Click Here
For More Axis Securities Disclaimer https://simplehai.axisdirect.in/disclaimer-home
SEBI Registration number is INZ000161633
Above views are of the author and not of the website kindly read disclaimer