Weekly Commodity Outlook Of 17-04-2021 By Swastika Investmart

Follow us Now on Telegram ! Get daily 10 - 12 important updates on Business, Finance and Investment. Join our Telegram Channel
https://t.me/InvestmentGuruIndiacom
Download Telegram App before Joining the Channel
FUNDAMENTALS OF COMMODITY:
* Oil futures ended lower on Friday, with WTI crude falling 0.5% to settle slightly above $63 per barrel, but still recording a fourth straight week of gains amid a slew of upbeat economic data out of the US and China. Retail sales in the US grew the most since May 2020, while new applications for US unemployment benefits fell to the lowest since the pandemic began in March 2020. Meantime, a larger-than-expected draw in crude oil inventories last week was reported by both the EIA and API. However, concerns over slow vaccination campaigns lingered amid rising coronavirus cases in some countries.
* LME copper futures were trading below $4.2 per pound on Friday but still up almost 3% this week and not far from February’s tenyear high of $4.3. A slew of better-thanexpected US and China data this week reinforced the view of a healthy economic recovery, while President Biden’s multitrillion-dollar infrastructure plan lent further optimism to the copper bulls. Looking for the supply side, coronavirusinduced disruptions in some South American mines have supercharged existing upward momentum in the market.
* Silver firmed close to a 1-month high at $26 per troy ounce on Friday, supported by expectations of increased industrial demand as the economic recovery gathers pace. Meantime, the dollar index stayed close to 1- month lows and Treasury yields remained well below 14-month highs reached in March. The white metal is heading for an over 2% weekly gain, after the USFDA recommended states pausing the use of Johnson & Johnson's coronavirus vaccine after six cases of blood clots while robust data out of the US and China capped some of this upside momentum.
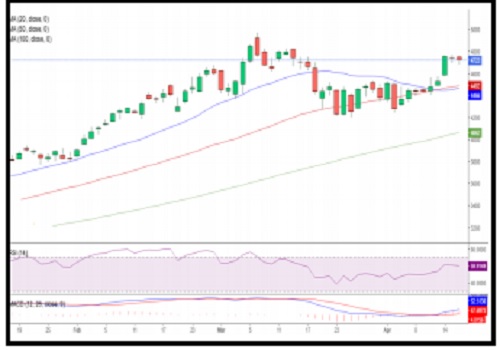
Technical indicators (Daily):
* RSI- 62.5644
* MACD- 440.1611
* MOVING AVERAGES (20,50,100)- (45540/45789/47575)
MCX GOLD CHART
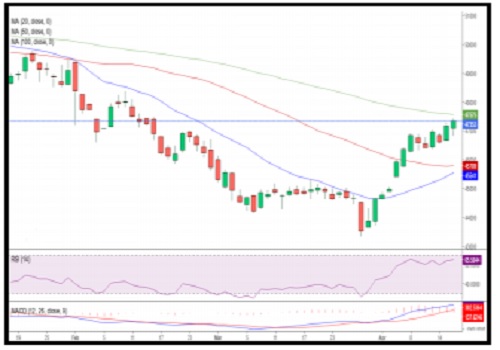
MCX CRUDE OIL CHART
* RSI- 59.9149
* MACD- 52.513
* MOVING AVERAGES (20,50,100)- (4466/4492/4062)
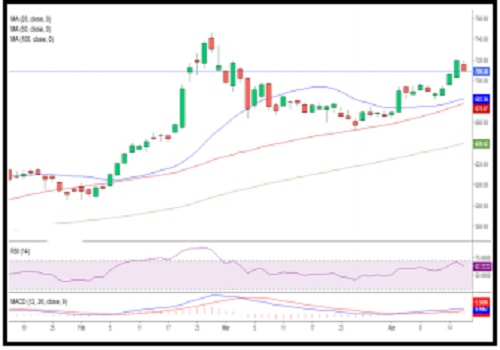
Technical indicators (Daily):
* RSI- 62.2222
* MACD- 9.4467
* MOVING AVERAGES (20,50,100) - (682.35/678.07/639.42)
MCX COPPER CHART
To Read Complete Report & Disclaimer Click Here
Please refer disclaimer at https://www.swastika.co.in/disclaimer
Views express by all participants are for information & academic purpose only. Kindly read disclaimer before referring below views. Click Here For Disclaimer