Banknifty opened sharply lower with a downward gap and selling pressure - Axis Securities

Follow us Now on Telegram ! Get daily 10 - 12 important updates on Business, Finance and Investment. Join our Telegram Channel
https://t.me/InvestmentGuruIndiacom
Download Telegram App before Joining the Channel
Nifty
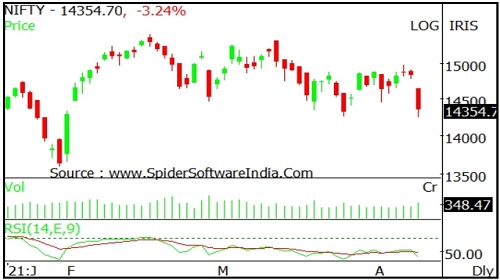
Nifty opened sharply lower with a downward gap and selling pressure throughout the session dragged it lower to close on a negative note. Nifty closed at 14311 with a loss of 524 points. On the daily chart the index has formed a big bearish candle after facing major resistance near the 14900 level.
The index continues to move in a Lower Top and Lower Bottom formation on the hourly chart indicating negative bias. The chart pattern suggests that if Nifty crosses and sustains above 14400 level it would witness buying which would lead the index towards 14500-14650 levels. However if index breaks below 14300 level it would witness selling which would take the index towards 14200-14000.
Nifty is trading below 20 day SMA indicating negative bias in the short to medium term. Nifty continues to remain in an uptrend in the medium and long term, so buying on dips continues to be our preferred strategy. The daily strength indicator RSI is moving downwards and is quoting below its reference line indicating negative bias. The trend deciding level for the day is 14405.
If NIFTY trades above this level then we may witness a further rally up to 14560-14810-14965 levels. However, if NIFTY trades below 14405 levels then we may see some profit booking initiating in the market, which may correct up to 14155-14000-13750 levels
Banknifty
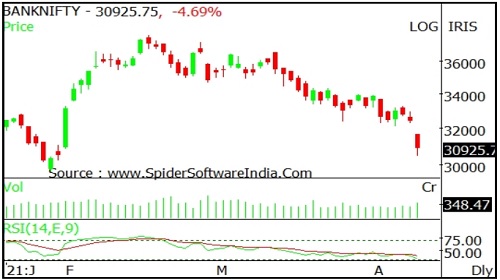
Banknifty opened sharply lower with a downward gap and selling pressure throughout the session dragged it lower to close on a negative note. Banknifty closed at 30792 with a loss of 1656 points. On the daily chart the index has formed a big bearish candle and has violated multiple day support of 32300 indicating negative bias.
The index is moving in a Lower Top and Lower Bottom formation on the daily chart indicating negative bias. The chart pattern suggests that if Banknifty crosses and sustains above 31500 level it would witness buying which would lead the index towards 32000-32500 levels. Important Supports for the day is around 30500 However if index sustains below 30500 then it may witness profit booking which would take the index towards 30000-29500 levels.
Banknifty is trading below 20 and 50 day SMA's which indicating negative bias in the short term. Banknifty continues to remain in an uptrend in the medium and long term, so buying on dips continues to be our preferred strategy. The daily strength indicator RSI is moving downwards and is quoting below its reference line indicating negative bias. The trend deciding level for the day is 31005.
If BANK NIFTY trades above this level then we may witness a further rally up to 31485-32180-32665 levels. However, if BANK NIFTY trades below 31005 levels then we may see some profit booking initiating in the market, which may correct up to 30310-29825-29130 levels.
To Read Complete Report & Disclaimer Click Here
For More Axis Securities Disclaimer https://simplehai.axisdirect.in/disclaimer-home
SEBI Registration number is INZ000161633
Views express by all participants are for information & academic purpose only. Kindly read disclaimer before referring below views. Click Here For Disclaimer