Nifty midcap and small cap indices extended - ICICI Direct

Follow us Now on Telegram ! Get daily 10 - 12 important updates on Business, Finance and Investment. Join our Telegram Channel
https://t.me/InvestmentGuruIndiacom
Download Telegram App before Joining the Channel
NSE (Nifty): 14325
Technical Outlook
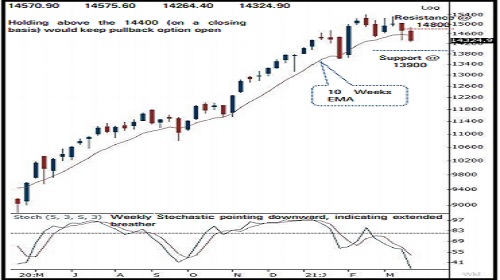
*chnical Outlook • The daily price action formed a sizable bear candle carrying lower high-low, indicating extended correction as index retraced 61% of February rally (13597-15432). Consequently, contrary to our expectation Nifty closed the session below immediate support of 14400 along with 2 nd consecutive close below 50 EMA
*Going by the historical rhythm of last one year, Nifty has attracted elevated buying demand after average 9% correction. In current scenario, Nifty has already corrected 8% from life high of 15432. Therefore, couple of percentage decline from here on can not be ruled out. We expect aforementioned rhythm to be maintained and therefore any extended correction from here on should not be construed as negative, instead it should be capitalised to construct portfolio from medium term perspective by accumulating quality large caps in staggered manner. Meanwhile, 14800 would act as immediate resistance on the upside
*Nifty midcap and small cap indices extended breather and approached in the vicinity of their 50 days EMA coincided with upward sloping trend line, which has been held on multiple occasions since June 2020. Key point to highlight during recent correction is that, the Nifty midcap and small cap indices have maintained the rhythm of not correcting for more than 9-10% since March 2020. In the current scenario, both indices have corrected 9% while sustaining above 50 days EMA. As the broader market approaches maturity of price wise correction, we expect both indices to form a higher base after couple of days breather and gradually regain upward momentum
*Structurally, we believe extended breather from here on would get anchored around key support zone of 14000-13900, as it is confluence of:
*a) 80% retracement of February rally (13597-15432), at 13964
*b) 9% correction from life high is placed around 14000
*C) 100 days EMA is placed at14000
*In the coming session, index is likely to witness gap up opening tracking firm global cues. We expect index to hold the derivative expiry low (spot-14264) and trade with a positive bias. Hence, use intraday dip towards 14428-14452 to create long for target of 14542.
NSE Nifty Weekly Candlestick Chart
Nifty Bank: 33006
Technical Outlook
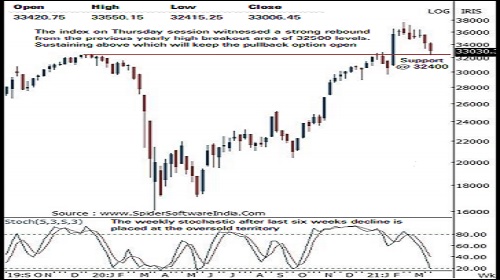
*The daily price action formed a bear candle with a lower high - low signalling continuation of the corrective bias . It however carries a long lower shadow as the index in the second half witnessed the strongest recovery in the last 20 sessions (1130 points) from its recent previous yearly high breakout area of 32500 levels
*Going ahead , index sustaining above Thursday's panic low (32415 ) will lead to a pullback towards 34400 levels as it is the confluence of the current week high and 50 % retracement of the last leg of decline ( 36497 -32415 ) . Failure to do so will lead to an extended correction in the coming sessions
*The last six weeks corrective decline has lead to the weekly stochastic placed at an oversold territory with a reading of 18 indicating an impending pullback in the coming weeks . However, the index require to start forming higher high -low in the daily chart on a sustained basis to signal a pause in the current corrective trend
*The major support for the index is currently placed at 32600 - 32400 levels being the confluence of the following technical observations :
a) 61 . 8 % retracement of the previous rally (29687 -37708 ) placed at 32750 levels
b) Major breakout area of previous multiple yearly highs placed around 32500 levels
*In the coming session, the index is likely to open on a positive note amid strong global cues . Volatility is expected to remain high . We expect the index to continue with its second half pullback as the weekly stochastic are at oversold territory . Hence, after a positive opening use intraday dips towards 33200 -33260 to create long position for target of 33490 , maintain a stoploss of 33090
Nifty Bank Index – Daily Candlestick Chart
To Read Complete Report & Disclaimer Click Here
https://secure.icicidirect.com/Content/StaticData/Disclaimer.html
Views express by all participants are for information & academic purpose only. Kindly read disclaimer before referring below views. Click Here For Disclaimer


Tag News

Stock Picks : TCS Ltd And Chambal Fertiliser Ltd By ICICI Direct