Nifty is trading above its 20 day SMA which indicates positive bias in the short term - Axis Securities

Follow us Now on Telegram ! Get daily 10 - 12 important updates on Business, Finance and Investment. Join our Telegram Channel
https://t.me/InvestmentGuruIndiacom
Download Telegram App before Joining the Channel
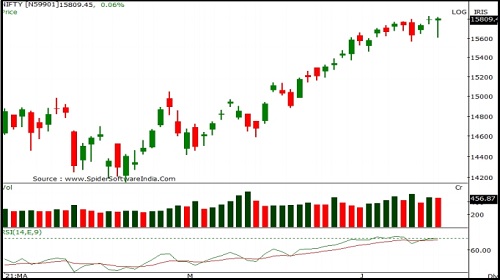
Nifty
Nifty opened on a flat note and witnessed selling for first part of the session. However last hour pullback action pulled index higher and recovered some of the earlier losses.Nifty closed at 15812 with a gain of 13 points.
On the daily chart index has formed a small bullish candle carrying long lower shadow indicating buying support at lower levels. The index is moving in a Higher Top and Higher Bottom formation on the daily chart indicating sustained up trend. The chart pattern suggests that if Nifty crosses and sustains above 15850 level it would witness buying which would lead the index towards 15900-16000 levels. However if index breaks below 15750 level it would witness selling which would take the index towards 15700-15650. Nifty is trading above its 20 day SMA which indicates positive bias in the short term. Nifty continues to remain in an uptrend in the medium and long term, so buying on dips continues to be our preferred strategy.
The daily strength indicator RSI is moving upwards and is above its reference line indicating positive bias
The trend deciding level for the day is 15745. If NIFTY trades above this level then we may witness a further rally up to 15890-15965-16105 levels. However, if NIFTY trades below 15745 levels then we may see some profit booking initiating in the market, which may correct up to 15670-15530-15455 levels.
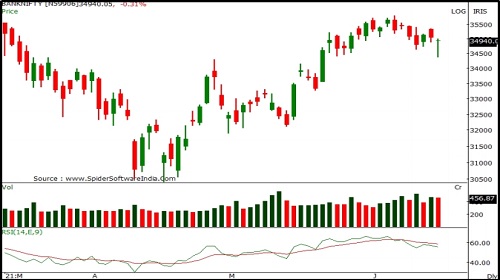
Banknifty
Banknifty opened lower with a downward gap and extended selling momentum in the first half however buying momentum at lower levels erased ealier losses to close on a flat note. Banknifty closed at 34951 with a loss of 97 points.
The price movement has resulted in a long “Legged Doji” candlestick pattern indicating uncertainty within bulls and bears. Since past couple of weeks index continue to consolidate in a broad trading range (35800-34300) representing sideways trend. The chart pattern suggests that if Banknifty crosses and sustains above 35000 levels it would witness buying which would lead the index towards 35400- 35700 levels. However if index breaks below 34600 level it would witness selling which would take the index towards 34200-33800. Banknifty is trading above 20 and 50 day SMA's indicating positive bias in the short to medium term. Banknifty continues to remain in an uptrend in the medium and long term, so buying on dips continues to be our preferred strategy.
The daily strength indicator RSI has turned negative from the overbought territory and is below its reference line indicating sustained downtrend.
The trend deciding level for the day is 34775. If BANK NIFTY trades above this level then we may witness a further rally up to 35170-35395-35795 levels. However, if BANK NIFTY trades below 34775 levels then we may see some profit booking initiating in the market, which may correct up to 34550- 34155-33930 levels.
To Read Complete Report & Disclaimer Click Here
For More Axis Securities Disclaimer https://simplehai.axisdirect.in/disclaimer-home
SEBI Registration number is INZ000161633
Views express by all participants are for information & academic purpose only. Kindly read disclaimer before referring below views. Click Here For Disclaimer