Weekly Commodity Outlook Of 03-04-2021 By Swastika Investmart

Follow us Now on Telegram ! Get daily 10 - 12 important updates on Business, Finance and Investment. Join our Telegram Channel
https://t.me/InvestmentGuruIndiacom
Download Telegram App before Joining the Channel
FUNDAMENTALS OF COMMODITY:
* WTI crude futures rose more than 3% to above $61 a barrel on Thursday, after OPEC+ has reached a deal to gradually ease production cuts from May. Major oil producers will increase output by 350,000 barrels per day in May, 350,000 bpd in June and 450,000 bpd in July. Prices have been recently under pressure due to concerns about extended restrictive measures in Europe, slow vaccine rollouts and rising COVID-19 cases in India and Brazil. Meanwhile, data from the EIA showed an unexpected draw in US crude stocks last week, while the API report released a day earlier had shown a bigger than expected build in inventories.
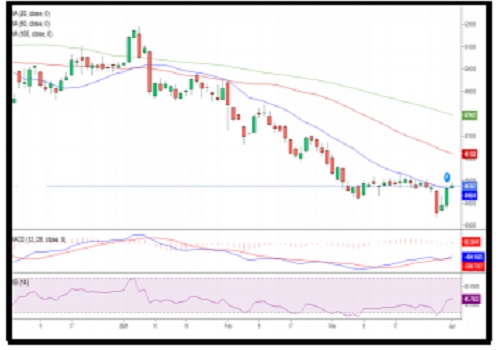
* Spot gold was little changed above the $1730 an ounce level in a thin trading session on Friday as many markets around the world are closed for the Good Friday holiday. Gold remained above a 3-week low of $1677 an ounce touched early in the week as both the US dollar and Treasury yields retreated slightly. Also, President Biden unveiled a $2.25 trillion infrastructure plan to boost the economic recovery, which could push inflation higher. Adding further pressure to gold is investors' interest in bitcoin.
* The London Metal Exchange three-month copper price settled down by 0.8% over the week to a closing price of $8,790 per tonne on Thursday April 1. This is down from a $9,562.50 per tonne on February 25. Copper demand growth outside of China is expected to be a driving force in 2021, a step change from recent years. It is shaping up to be a year of significant deficit in the copper market as tighter-than-expected supply struggles to keep up with a radically improved demand outlook.
Technical indicators (Daily):
* RSI- -484.1685
* MACD- -506.8387
* MOVING AVERAGES (20,50,100)- (44663.7/46188.02/47941.78)
MCX GOLD CHART
MCX CRUDE OIL CHART
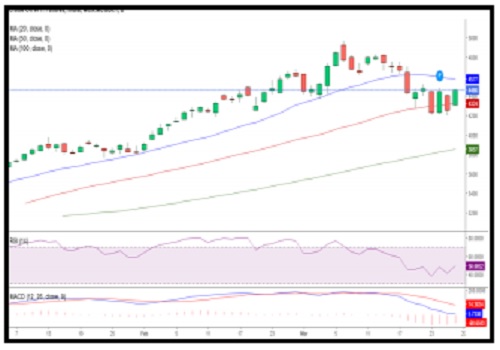
Technical indicators (Daily):
* RSI- 52.0035
* MACD- 0.5901
* MOVING AVERAGES (20,50,100)- (4561/4372.16/3920.07)
MCX COPPER CHART
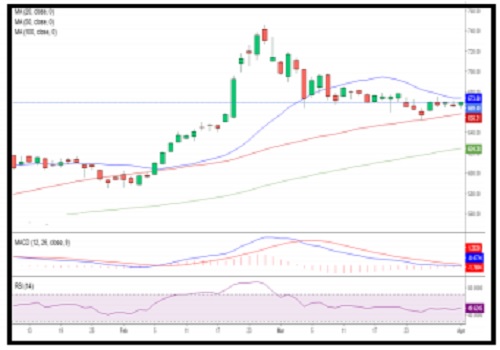
Technical indicators (Daily):
* RSI- 49.6245
* MACD- 0.4822
* MOVING AVERAGES (20,50,100) - (673.79/658.31/624.28)
To Read Complete Report & Disclaimer Click Here
Please refer disclaimer at https://www.swastika.co.in/disclaimer
Views express by all participants are for information & academic purpose only. Kindly read disclaimer before referring below views. Click Here For Disclaimer