Copper, Natural Gas, Silver and Zinc Commodity Report Of 29 /06/2021 - Enrich Financial Solution
Follow us Now on Telegram ! Get daily 10 - 12 important updates on Business, Finance and Investment. Join our Telegram Channel
https://t.me/InvestmentGuruIndiacom
Download Telegram App before Joining the Channel
COPPER
Technical outlook
Copper July future 4hr chart has formed "Descending broadening wedge" pattern. The last few sessions ended up sideways mode along with some corrections inside the channel. The market is still expected to continue on bearish momentum based on the current price action, once the same break below the current key support holding near 718. The downside rally could be testing all the way up to 715-712 levels in the upcoming sessions. Alternatively, if the market struggles to break the support level, then it might revise the trend to bullish/sideways mode. Key resistance holds at 724. A slide to 727 is also a possibility if the price makes or break above the current resistance level.
Technical Chart

To Read Complete Report & Disclaimer Click Here
NATURAL GAS
Technical outlook
Natural gas 4hr chart has formed “Ascending broadening wedge” pattern. The last session ended up bullish mode but along with a long correction inside the channel, creating a new high after a long term. The market is expected to continue on the bearish momentum based on the price action, once break below a key support holding near 267. The downside rally could be testing all the way through 264-261 levels in the upcoming sessions. Alternatively, if the market struggles to break the support level, then it might retest the same and turn bullish/sideways once again. Key resistance holds at 271. A slide to 274- 277 is also a possibility if the price makes or break above the current resistance level.
Technical Chart

To Read Complete Report & Disclaimer Click Here
SILVER
Technical outlook
MCX Silver July futures technical chart has taken the formation of "Descending broadening wedge" pattern in 4hr time frame. Last few sessions ended up sideways mode along with some corrections inside the channel. The market is expected to continue on bearish momentum based on the current price action, once the same break below the key support level holding near 67800. The downside rally could be extending all the way up to 67200- 66600 levels in the upcoming sessions. An alternative scenario indicates that if the market struggles to break the support level, then it might retest the same and revise the trend to bullish/sideways mode once again. Key resistance holds near 68400. A slide to 69000-69600 is also a possibility if the price makes or break above the current resistance level.
Technical Chart

To Read Complete Report & Disclaimer Click Here
ZINC
Technical outlook
Zinc July future daily Chart has formed "Megaphone chart" pattern. The last few sessions ended up sideways mode along with some corrections inside the channel. The market is expected to continue on the bearish term based on the current price action, once the same breaks below the current key support holding near 234. The downside rally could be testing all the way up to 232.50-231 levels in the upcoming sessions. Alternatively, if the market struggles to break the support level, then it might retest the same and revise the trend to bullish/sideways. Key resistance holds at 236. A slide to 237.50-239 is also a possibility if the price makes or break above the current resistance level.
Technical Chart

To Read Complete Report & Disclaimer Click Here
Please refer disclaimer at https://enrichbroking.in/disclaimer
SEBI Registration number is INZ000078632
Views express by all participants are for information & academic purpose only. Kindly read disclaimer before referring below views. Click Here For Disclaimer


Top News
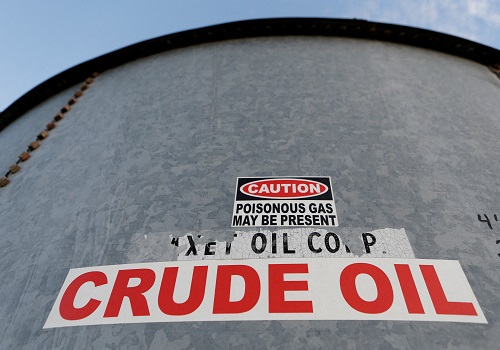
Oil gains $5 on weaker dollar, tight supplies


Tag News

We anticipate immense potential benefits from the upcoming Sovereign Gold Bond Tranche in FY...