Weekly Tech Picks - Elecon Engineering Company Limited, Indus Towers Limited, ACC Limited, Pidilite Industries Limited By Axis Securities

Follow us Now on Telegram ! Get daily 10 - 12 important updates on Business, Finance and Investment. Join our Telegram Channel
https://t.me/InvestmentGuruIndiacom
Download Telegram App before Joining the Channel
Elecon Engineering Company Limited
• On the weekly chart, the stock has witnessed “rounding bottom” breakout around 220 levels and sustaining above the same
• This breakout is accompanied with huge volumes indicating increased participation
• In addition, the stock has confirmed higher tops and bottoms
• The stock is well placed above its 20, 50 , 100 and 200 SMA which reconfirmed bullish trend
• The daily and weekly strength indicator RSI is in bullish mode along with positive crossover which supports rising strength in near term.
• The above analysis indicate an upside of 280-295 levels.
• *Holding period is 3 to 4 weeks.
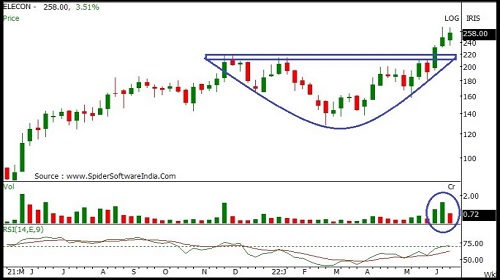
Buy Elecon Engineering Company Limited CMP: 258 Buy Range: 252-247 Stop loss: 233 Upside: 12% - 18%
Indus Towers Limited
• On the daily chart, the stock has observed two months “consolidation range ” (208-195) breakout at 208 levels strong come of bulls
• This buying momentum was accompanied with huge volumes indicating increased participation at breakout level
• The stock is also well placed above 20, and 50 day SMA which supports upside momentum
• The daily and weekly strength indicator RSI signals positive crossover indicate rising strength
• The above analysis indicate upside of 225-235 levels.
*Holding period is 3 to 4 weeks.
Buy Indus Towers Limited CMP: 211 Buy Range: 211-206 Stop loss: 195 Upside: 8% – 13%
ACC Limited – June Fut.
• On the daily chart, the stock has confirmed “multiple support ” breakdown around 2100 levels on a closing basis
• Since past couple of months, the stock is facing stiff supply pressure from down sloping trend line
• This breakdown is accompanied with 17June,2022huge volumes indicating increased selling pressure
• The stock is sustaining below its 20, 50, 100 and 200 day SMA which reconfirm bearish trend
• The daily, weekly and monthly strength indicator RSI continue to remain bearish which supports weakening trend
• The above analysis indicate downside of 1980-1930 levels.
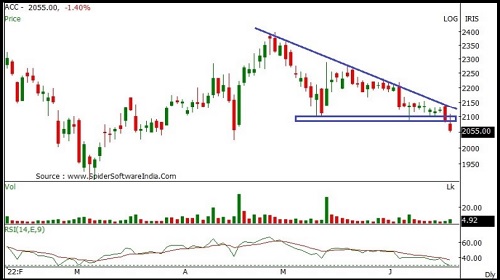
Sell ACC Limited – June Fut. CMP: 2066 Sell Range: 2070-2110 Stop loss: 2160 Downside: 5% – 8%
Pidilite Industries Limited -June Fut.
• On the daily chart, the has confirmed “multiple resistance” (132) breakout on a closing basis
• This breakout is accompanied with huge volumes which signals increased participation
• The stock has recaptured its 20, 50, ,100 and 200 day SMA and rebounded 13 April,2022very sharply
• The daily “band bollinger” buy signal reconfirm positive bias
• The daily and weekly strength indicator RSI signals positive crossover indicate rising strength
• The above analysis indicate upside of 147-153 levels.
• Holding period is 3 to 4 weeks.
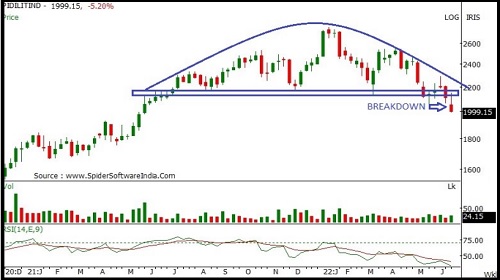
Sell Pidilite Industries Limited -June Fut. CMP: 2003 Sell Range: 2030-2070 Stop loss: 2145 Downside: 6% –10%
To Read Complete Report & Disclaimer Click Here
For More Axis Securities Disclaimer https://simplehai.axisdirect.in/disclaimer-home
SEBI Registration number is INZ000161633
Above views are of the author and not of the website kindly read disclaimer